Hi,

How can I put the bottom axis on top (or on top AND on bottom) for a barh plot?
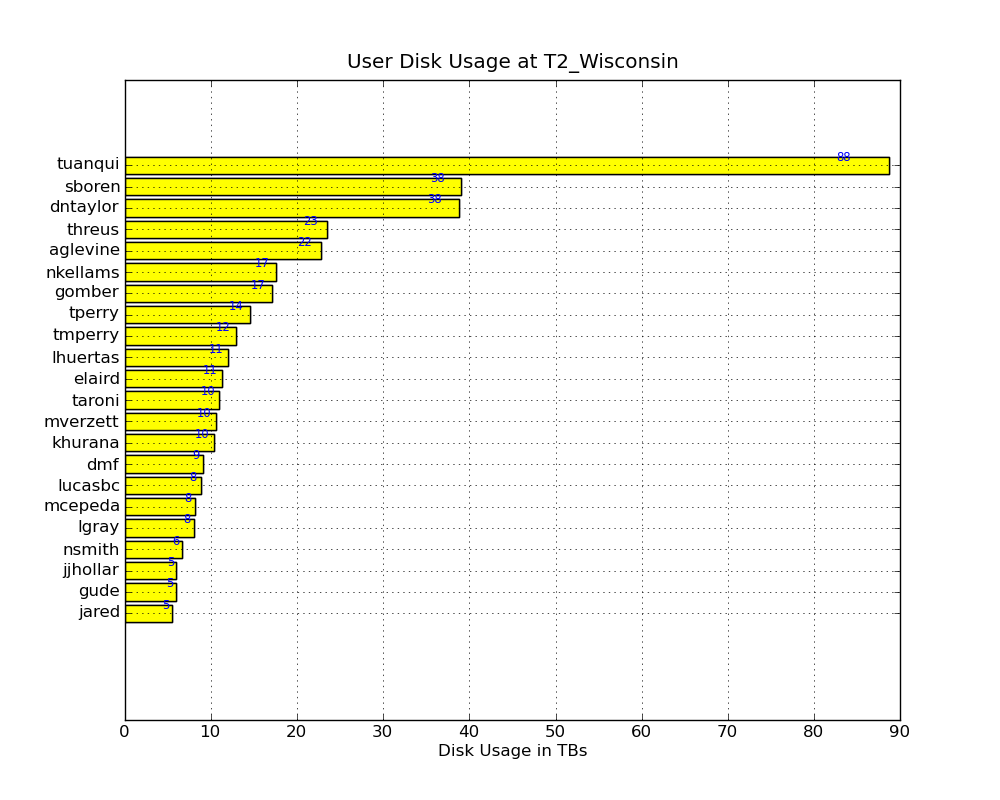
I'm trying to mimic this, made with gnuplot:

  http://www.hep.wisc.edu/cms/comp/cmsprod/dCacheUserUsage.png

within matplotlib, and I've come close,

  http://www.hep.wisc.edu/cms/comp/cmsprod/diskUserUsage.png


Also, is it possible to just have grid lines in one direction (say, vertical),
I don't think the horizontal grid is necessary.

Thanks for any help,
Mike


PS: Anyone who is interested, my script for making that is here,
  http://www.hep.wisc.edu/cms/comp/cmsprod/plotDiskUse.py

------------------------------------------------------------------------------
Let Crystal Reports handle the reporting - Free Crystal Reports 2008 30-Day
trial. Simplify your report design, integration and deployment - and focus on
what you do best, core application coding. Discover what's new with
Crystal Reports now.  http://p.sf.net/sfu/bobj-july
_______________________________________________
Matplotlib-users mailing list
[email protected]
https://lists.sourceforge.net/lists/listinfo/matplotlib-users