Hi!

>> How can I put the bottom axis on top (or on top AND on bottom) for a barh
>> plot?
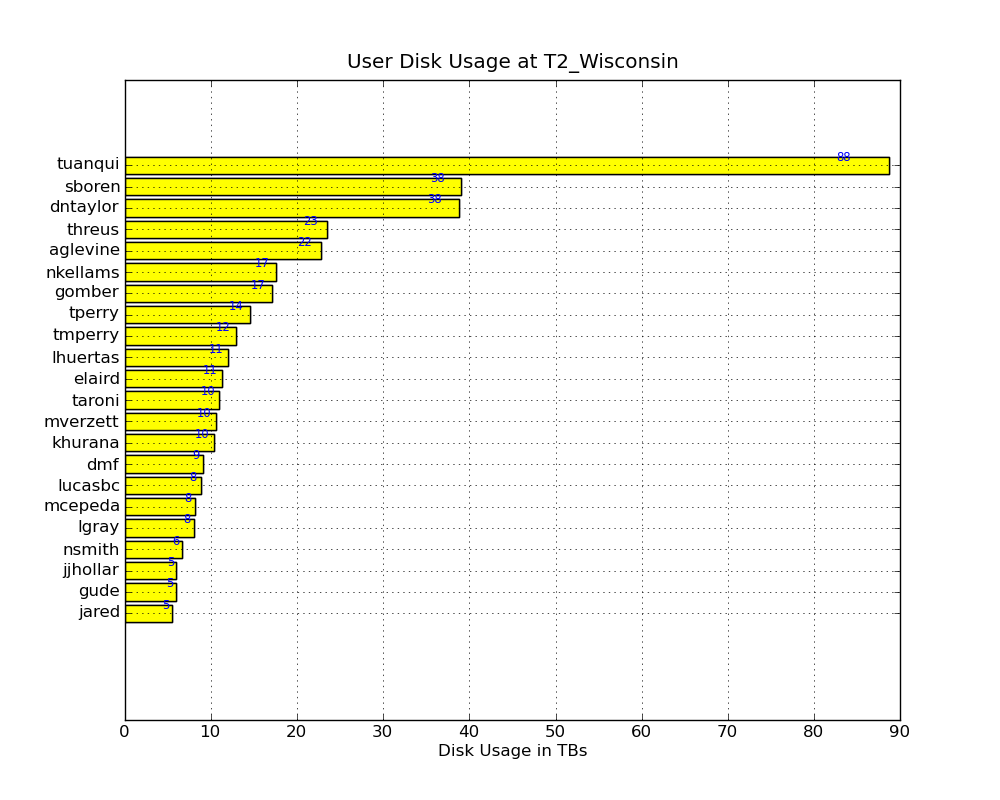
> It's somewhat counter-intuitive, but it can be done.
> You have to create some "twin" axes with the "twiny" option,
> then make the plot on the twin axes so it will use the
> top axis. The bottom axis still have to be adjusted manually
> to make it match the top one and remove the labels.
>
> See this example:
>

Thanks for your example.  With your help I was able to finally create this with
matplotlib,
  http://www.hep.wisc.edu/cms/comp/cmsprod/diskUserUsage.png
and this is my final script,
  http://www.hep.wisc.edu/cms/comp/cmsprod/plotDiskUse.py


One thing that surprised me was to shrink the font for the names required
changing ax1 even though the barh plot is on ax2.  See these lines:

----------
  ax2.barh(pos, listUse, color=listColors, height=1.0, align='center')
     ...
  for tick in ax1.yaxis.get_major_ticks():
    tick.label1.set_fontsize(8)
----------

Surprising.
Mike

------------------------------------------------------------------------------
Let Crystal Reports handle the reporting - Free Crystal Reports 2008 30-Day
trial. Simplify your report design, integration and deployment - and focus on
what you do best, core application coding. Discover what's new with
Crystal Reports now.  http://p.sf.net/sfu/bobj-july
_______________________________________________
Matplotlib-users mailing list
[email protected]
https://lists.sourceforge.net/lists/listinfo/matplotlib-users