dlmarion commented on pull request #2305:
URL: https://github.com/apache/accumulo/pull/2305#issuecomment-942547372
Tested by doing the following: 1. Started Telegraf, InfluxDB, and Grafana using the Docker image and instructions from https://github.com/artlov/docker-telegraf-influxdb-grafana. Specifically, I created directories `/tmp/metrics/influxdb` (mode 777) and `/tmp/metrics/grafana` to mount to the Docker container for persistence. Also, I had to supply a custom [telegraf.conf](https://github.com/dlmarion/accumulo-micrometer-stuff/blob/master/telegraf.conf) file, which is configured such that the StatsD input will parse the DataDog format. The container can then be started using the command: ``` docker run --ulimit nofile=66000:66000 -d \ --name tig-stack \ -p 3003:3003 \ -p 3004:8888 \ -p 8086:8086 \ -p 22022:22 \ -p 8125:8125/udp \ -v /tmp/metrics/influxdb:/var/lib/influxdb \ -v /tmp/metrics/grafana:/var/lib/grafana \ -v /path/to/telegraf/conf:/etc/telegraf \ artlov/docker-telegraf-influxdb-grafana:latest ``` 2. Next, I modified the Accumulo configuration before starting it. First, I added the following to `accumulo.properties`: ``` general.micrometer.enabled=true general.micrometer.jvm.metrics.enabled=true general.micrometer.factory=org.apache.accumulo.test.metrics.TestStatsDRegistryFactory ``` Then, I added the following to the JAVA_OPTS variable in `accumulo-env.sh`: ``` "-Dtest.meter.registry.host=127.0.0.1" "-Dtest.meter.registry.port=8125" ``` Finally, I had to copy the jar containing the `TestStatsDRegistryFactory` (which is in the accumulo-test jar) and the Micrometer StatsD Registry jar into the lib directory: ``` cd lib cp /path/to/accumulo-test-2.1.0-SNAPSHOT.jar . curl -L -o micrometer-registry-statsd-1.7.4.jar https://search.maven.org/remotecontent?filepath=io/micrometer/micrometer-registry-statsd/1.7.4/micrometer-registry-statsd-1.7.4.jar ``` 3. Next I logged into Grafana and setup the data source using the instructions at https://github.com/artlov/docker-telegraf-influxdb-grafana#grafana. Then, I built a sample dashboard (see below). The dashboard can be imported into Grafana from JSON located at https://github.com/dlmarion/accumulo-micrometer-stuff/blob/master/Accumulo%20Micrometer%20Test%20Dashboard-1634142129369.json. 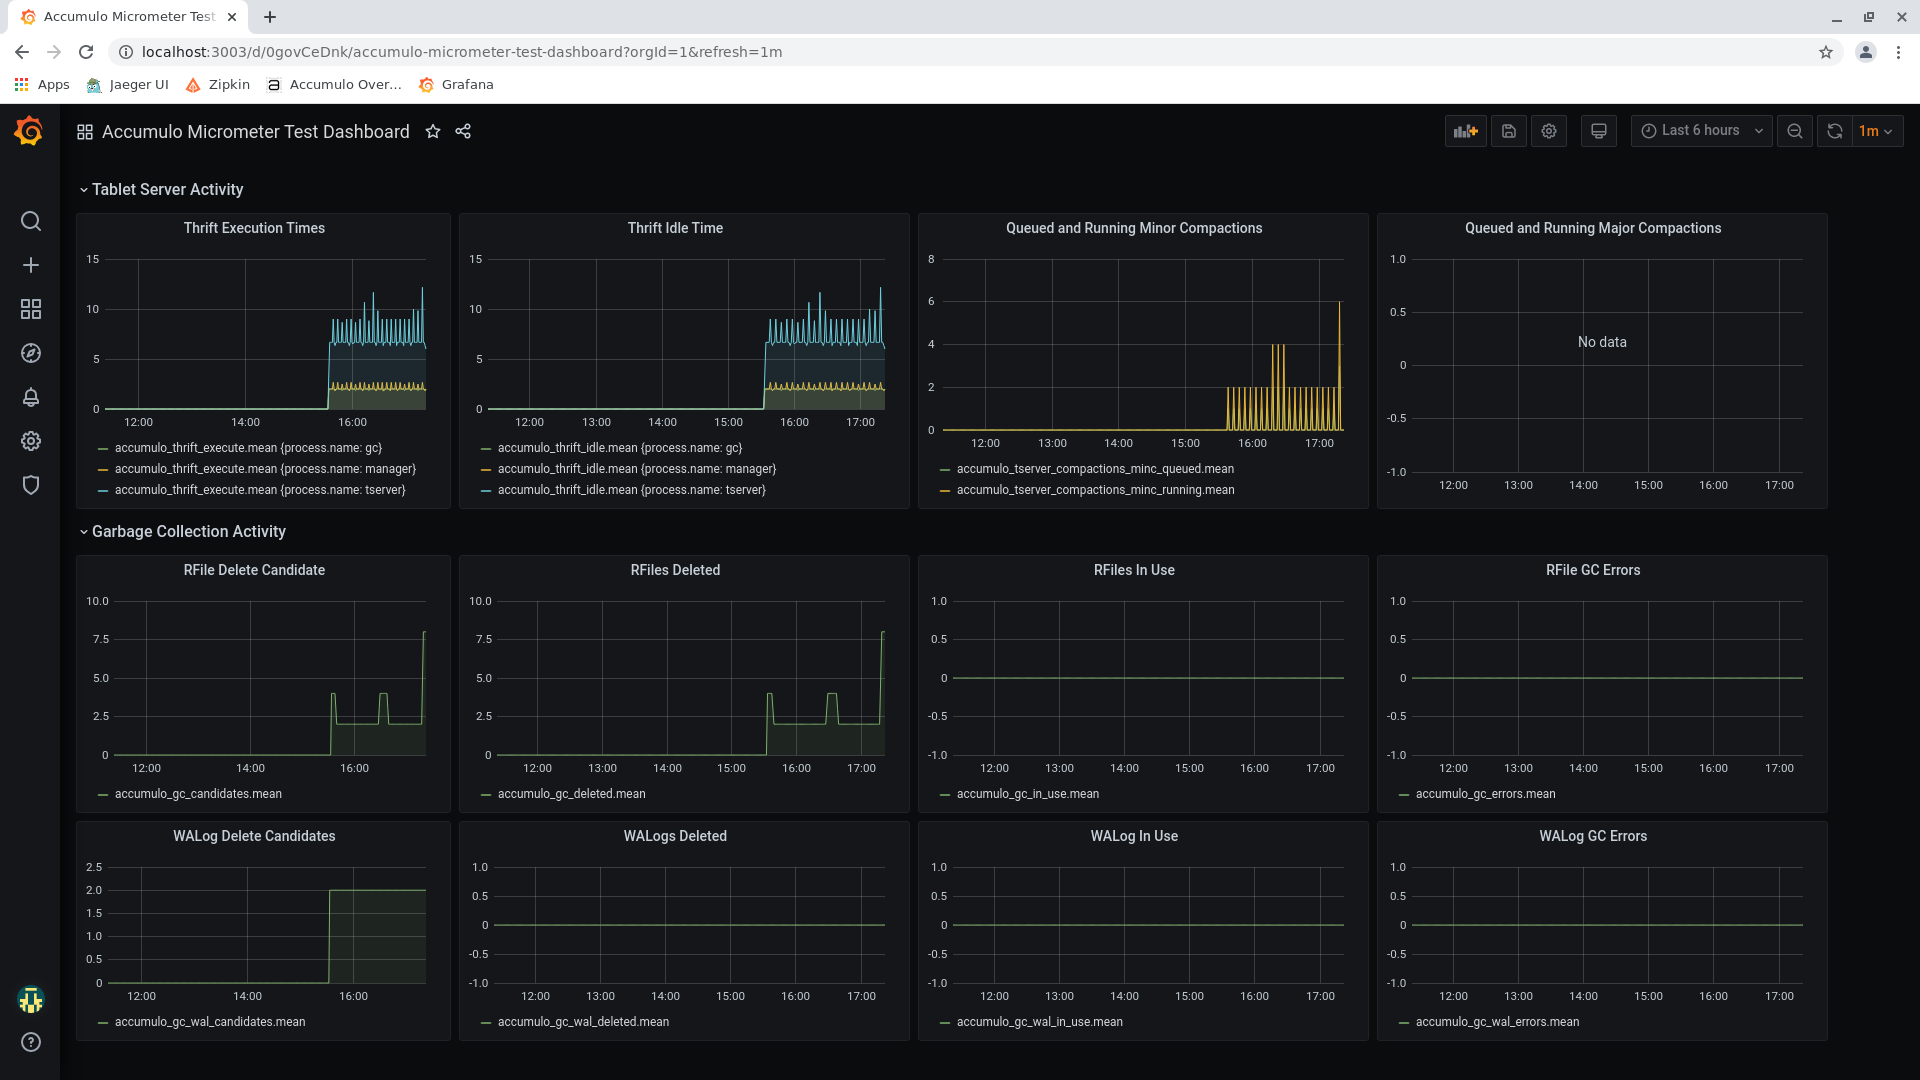 -- This is an automated message from the Apache Git Service. To respond to the message, please log on to GitHub and use the URL above to go to the specific comment. To unsubscribe, e-mail: [email protected] For queries about this service, please contact Infrastructure at: [email protected]