Dear all,
I'm new to MVPA and I'm trying to use PyMVPA to get a different view of
EEG data. I've chosen a simple problem first, so I am able to learn
things, and will then apply what I learn to more complex problems. This
means that what I am currently trying to do, doesn't actually provide
any new insights, but bear with me.
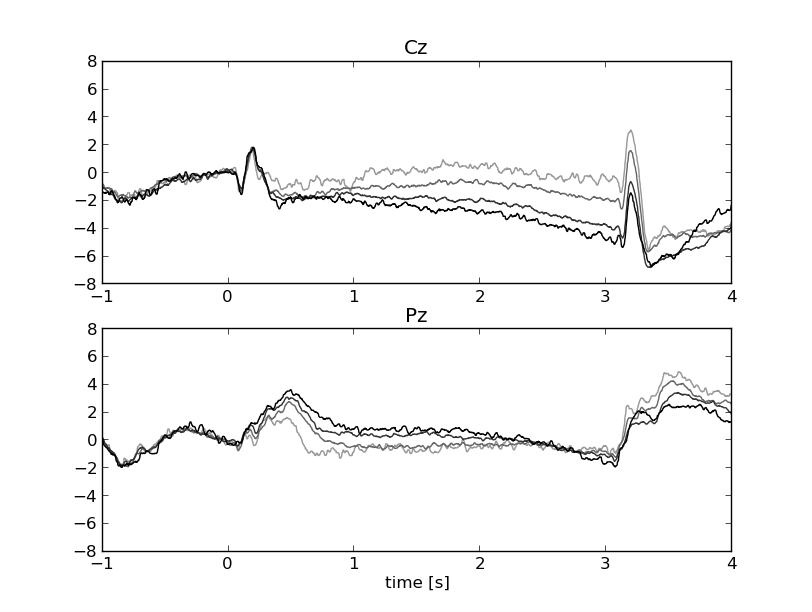
In the experiment there are 4 conditions that allow different amounts of
motor preparation. One way to look at motor preparation is to look at
the CNV, which basically is a long ERP on central electrodes. (I use
data from 8 subjects here.) See here:
http://www.mariusthart.net/images/CNV_Cz-Pz_c18_pp1-8.png
The preparation interval is 3 seconds and starts at 0. Darker lines mean
more motor preparation allowed, and the conditions seem to line up
neatly (although in reversed order) on Cz and Pz. However, Pz seems to
be more informative early on in the interval, whereas Cz takes over
after about 1 second.
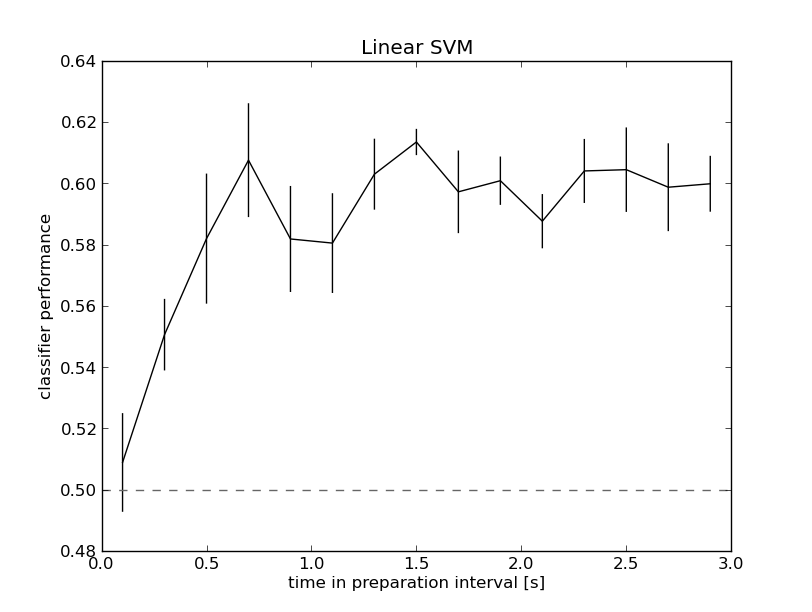
My toy problem is to classify the two most extreme conditions (two
targets) based on averaged Cz and Pz activity (two features) for every
200ms epoch in the preparation interval. An N-fold partitioner using a
linear SVM performs at chance at the start of the interval, and then
reaches a plateau at about 60% pretty quickly. Not spectacular maybe,
but I was pretty excited to get some results and hope it is good enough
for what I want to do next. See performance here:
http://www.mariusthart.net/images/LinSVM_Cz-Pz_c18_pp1-8.png
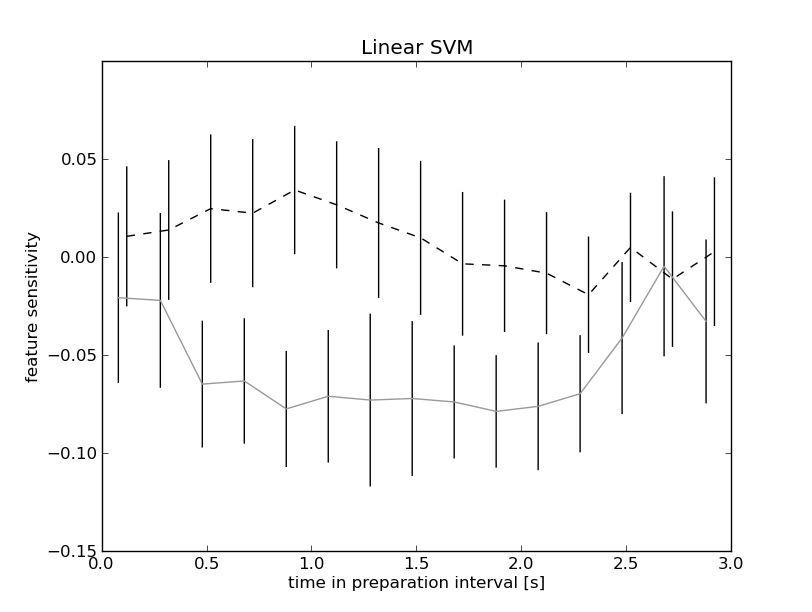
In the CNV plot it looked like the usefulness of Pz and Cz for the
classifier(s) should flip at around 1 second in the preparation
interval, so I wanted to look at sensitivity. There are a few lines on
that in the FAQ, and I kind of figured out how to gather all the
sensitivity datasets and could then perhaps just plot that. In it's raw
form, this looks like this:
http://www.mariusthart.net/images/LinSVMsens_Cz-Pz_c18_pp1-8.png
(The gray line is Cz and the dashed line is Pz.)
At this point, you people might be able to tell me that what I am doing
is completely wrong in several different ways... please do, if this is
the case!
That doesn't look like what I expected - but I find it hard to judge if
what I'm doing is actually correct. For example, on inspecting all the
different sensitivity datasets, it looks like the sign that each feature
gets is usually the same... but there are a few exceptions. Does the
sign actually mean anything in terms of a feature's usefulness? I would
say not - but I might be totally wrong here. I looked for this online,
but couldn't find it, maybe because I'm looking in the wrong spots.
However, when I use the absolute sensitivities the plot looks a bit
different, but still not like what I would expect. Cz has a higher
sensitivity during the whole interval. So first noob question is does
the sign of the feature weights has any significance?
When I look at the individual sensitivity datasets, they look like this:

In [19]: sensitivities[0]
Out[19]: Dataset(array([[ 0.14507451, -0.02963355]]),
sa=SampleAttributesCollection(items=[ArrayCollectable(name='targets',
doc=None, value=array([[8, 1]]), length=1),
ArrayCollectable(name='biases', doc='Sequence attribute',
value=array([-0.63935516]), length=1)]),
fa=FeatureAttributesCollection(items=[]),
a=DatasetAttributesCollection(items=[]))
Now there is a number -0.63935516 that puzzles me. Second noob question:
what does this 'bias' number mean?
There is also an array with the targets [8, 1] that very rarely switches
order... Searching by hand I checked several hundred before finding one
example, and the signs on the sensitivities were switched, but this is
highly anecdotal evidence for that meaning anything. Third noob
question, does the order of targets in that array have any significance?
Thanks for any feedback!

Marius

_______________________________________________
Pkg-ExpPsy-PyMVPA mailing list
[email protected]
http://lists.alioth.debian.org/cgi-bin/mailman/listinfo/pkg-exppsy-pymvpa