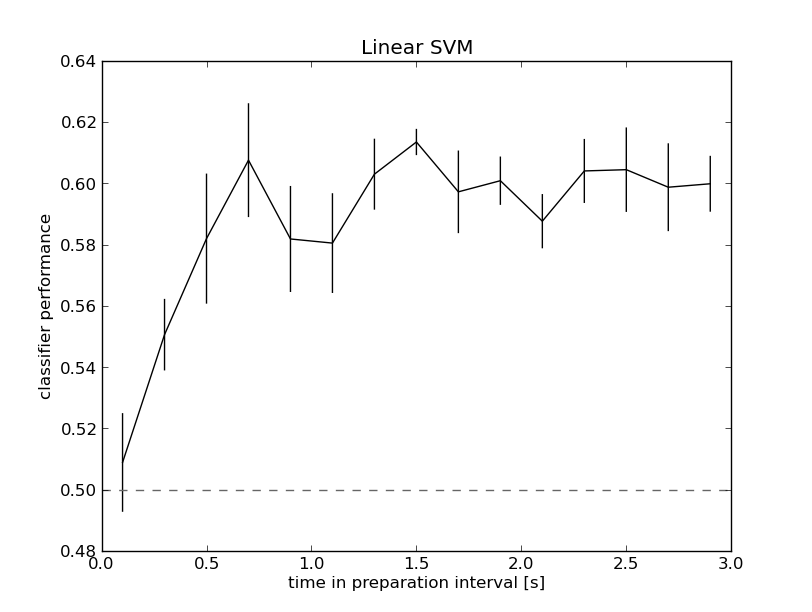
On Jan 12, 2014, at 9:40 PM, Marius 't Hart wrote:

>
> My toy problem is to classify the two most extreme conditions (two targets)
> based on averaged Cz and Pz activity (two features) for every 200ms epoch in
> the preparation interval. An N-fold partitioner using a linear SVM performs
> at chance at the start of the interval, and then reaches a plateau at about
> 60% pretty quickly. Not spectacular maybe, but I was pretty excited to get
> some results and hope it is good enough for what I want to do next. See
> performance here:
> http://www.mariusthart.net/images/LinSVM_Cz-Pz_c18_pp1-8.png
Did you provide an equal number of samples for each class (target)? Because if
you didn't then 60% could, in principle, be due to chance. That is, if 60% of
the samples are in one class in the training set, then a 'naive' classifier
that is just guessing that class all the time will give 60% accuracy.

Also: what preprocessing did you do? Any z-scoring, baseline correction etc?

>
> In the CNV plot it looked like the usefulness of Pz and Cz for the
> classifier(s) should flip at around 1 second in the preparation interval, so
> I wanted to look at sensitivity. [...] That doesn't look like what I expected
> - but I find it hard to judge if what I'm doing is actually correct. For
> example, on inspecting all the different sensitivity datasets, it looks like
> the sign that each feature gets is usually the same... but there are a few
> exceptions. Does the sign actually mean anything in terms of a feature's
> usefulness?

As far as I know the sign is not that important - it's more about the relative
magnitude. If the sensitivity is further away from zero then that means the
feature is more important for discriminating the classes.
>
> When I look at the individual sensitivity datasets, they look like this:
>
> In [19]: sensitivities[0]
> Out[19]: Dataset(array([[ 0.14507451, -0.02963355]]),
> sa=SampleAttributesCollection(items=[ArrayCollectable(name='targets',
> doc=None, value=array([[8, 1]]), length=1), ArrayCollectable(name='biases',
> doc='Sequence attribute', value=array([-0.63935516]), length=1)]),
> fa=FeatureAttributesCollection(items=[]),
> a=DatasetAttributesCollection(items=[]))
>
> Now there is a number -0.63935516 that puzzles me. Second noob question: what
> does this 'bias' number mean?

I'm not an expert on this... maybe it's the offset from the separating
hyperplane, i.e. all vectors x for which dot(a,x)=b with b the bias and a the
sensitivities?


_______________________________________________
Pkg-ExpPsy-PyMVPA mailing list
[email protected]
http://lists.alioth.debian.org/cgi-bin/mailman/listinfo/pkg-exppsy-pymvpa