zhli1142015 opened a new pull request #29908:
URL: https://github.com/apache/spark/pull/29908
<!--
Thanks for sending a pull request! Here are some tips for you:
1. If this is your first time, please read our contributor guidelines:
https://spark.apache.org/contributing.html
2. Ensure you have added or run the appropriate tests for your PR:
https://spark.apache.org/developer-tools.html
3. If the PR is unfinished, add '[WIP]' in your PR title, e.g.,
'[WIP][SPARK-XXXX] Your PR title ...'.
4. Be sure to keep the PR description updated to reflect all changes.
5. Please write your PR title to summarize what this PR proposes.
6. If possible, provide a concise example to reproduce the issue for a
faster review.
7. If you want to add a new configuration, please read the guideline first
for naming configurations in
'core/src/main/scala/org/apache/spark/internal/config/ConfigEntry.scala'.
-->
### What changes were proposed in this pull request?
<!--
Please clarify what changes you are proposing. The purpose of this section
is to outline the changes and how this PR fixes the issue.
If possible, please consider writing useful notes for better and faster
reviews in your PR. See the examples below.
1. If you refactor some codes with changing classes, showing the class
hierarchy will help reviewers.
2. If you fix some SQL features, you can provide some references of other
DBMSes.
3. If there is design documentation, please add the link.
4. If there is a discussion in the mailing list, please add the link.
-->
### Why are the changes needed?
<!--
Please clarify why the changes are needed. For instance,
1. If you propose a new API, clarify the use case for a new API.
2. If you fix a bug, you can clarify why it is a bug.
-->
Event log contains all tasks' metrics data, which are useful for performance
debugging. By now, spark UI only displays final aggregation results, much
information is hidden by this way. If spark UI could provide time series data
view, it would be more helpful to performance debugging problems. We would like
to build application statistics page in history server based on task metrics to
provide more straight forward insight for spark application.
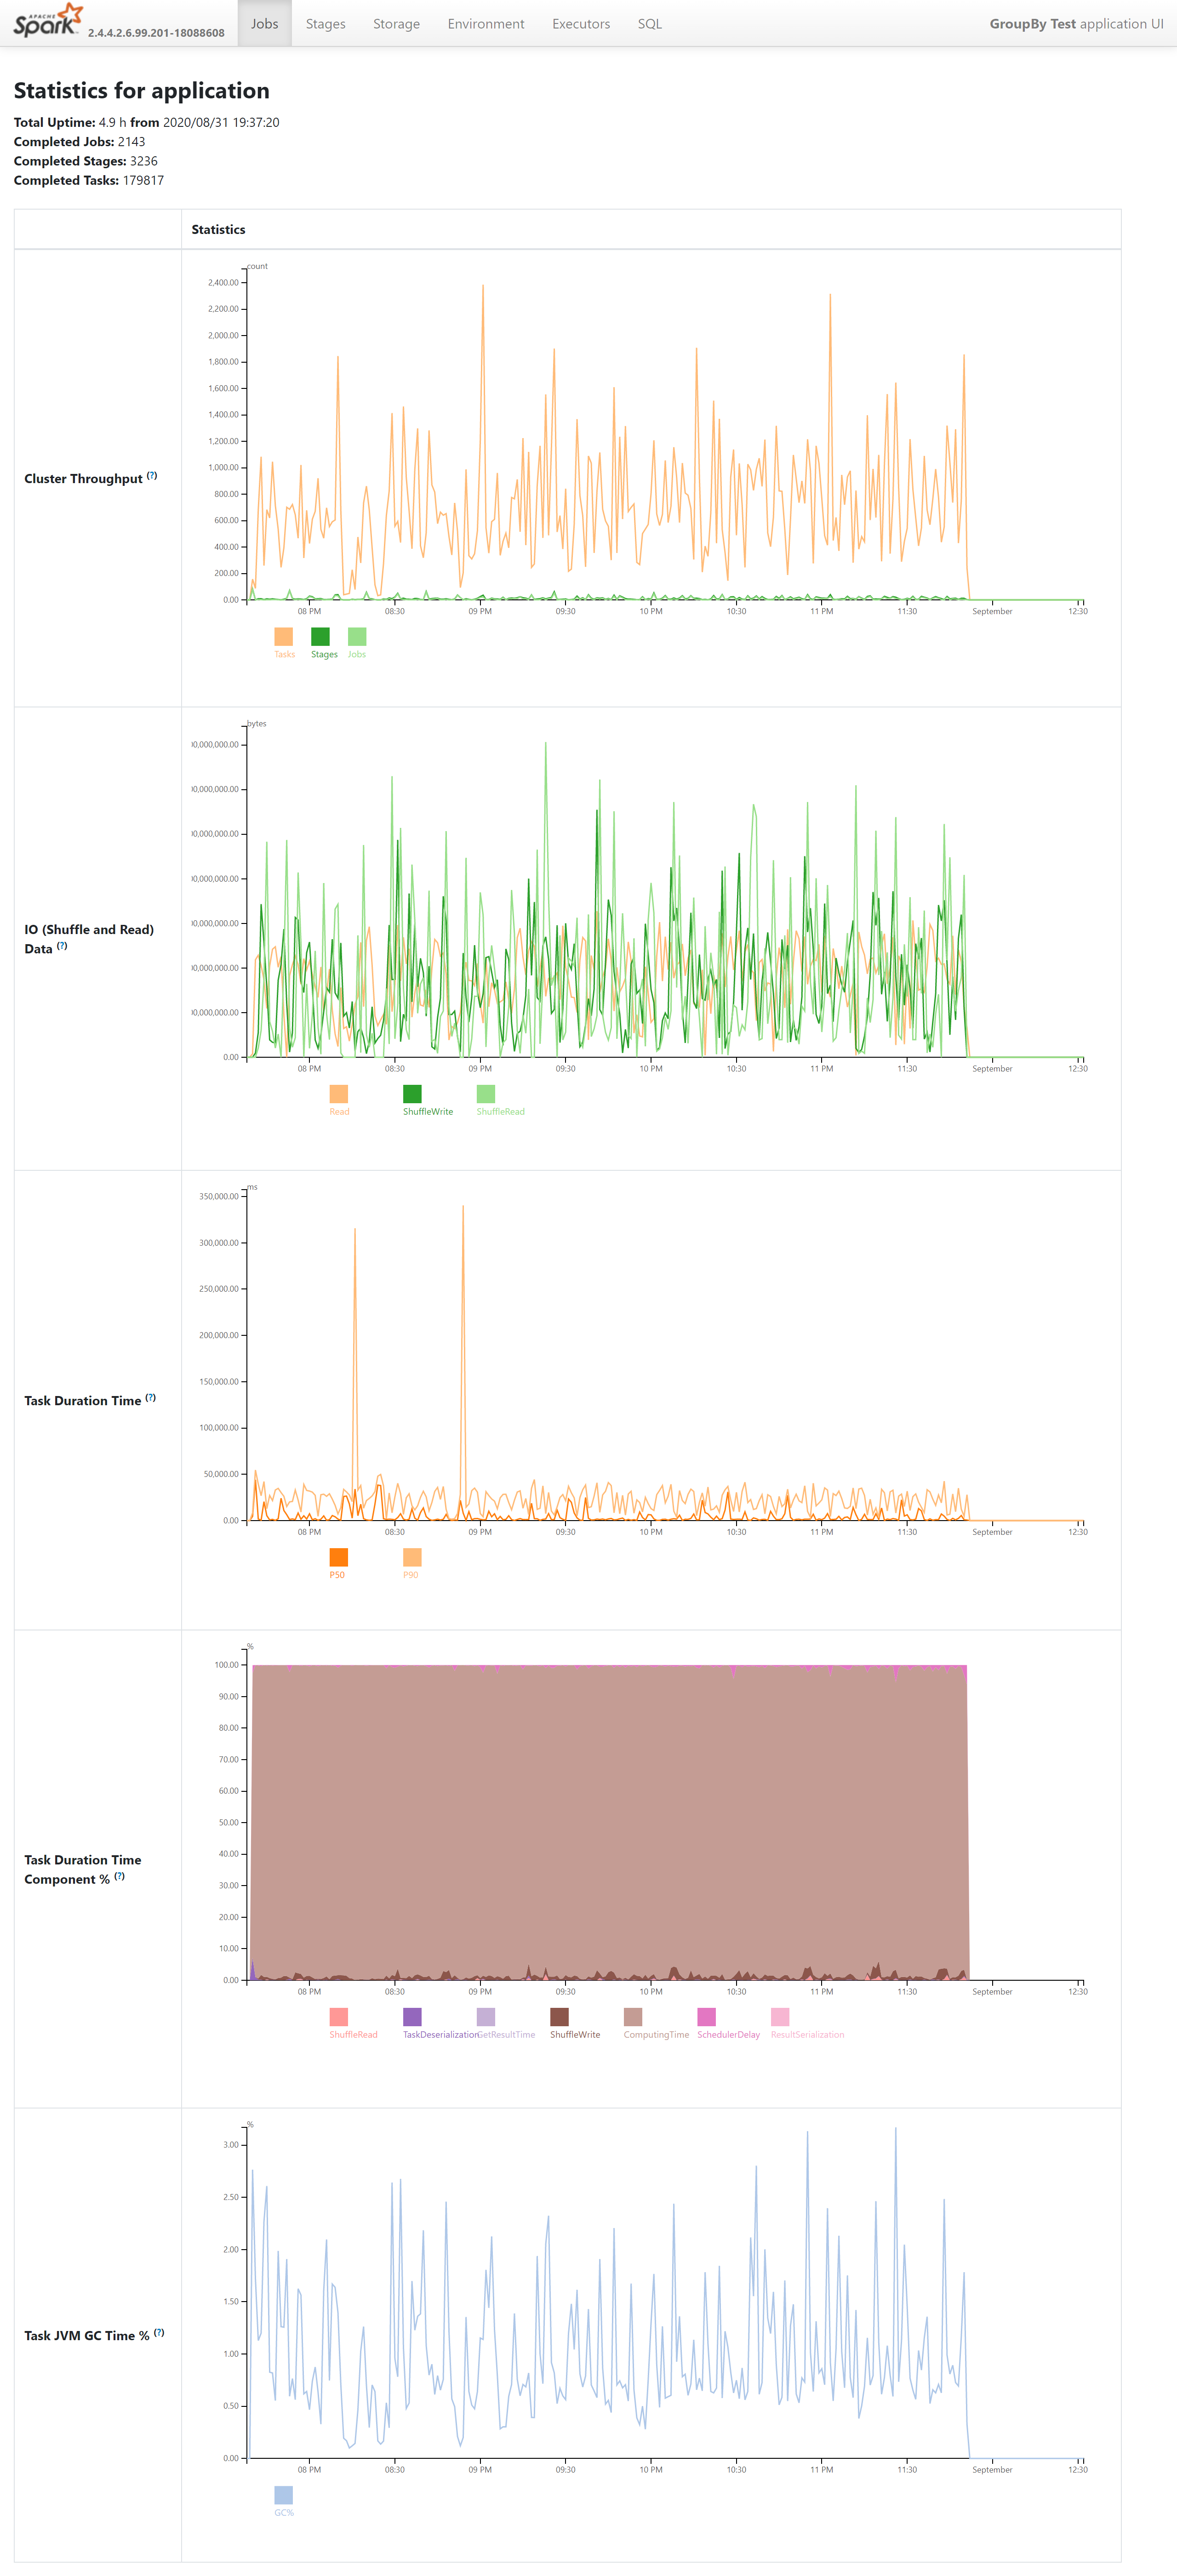
Below are views in application statistics page:
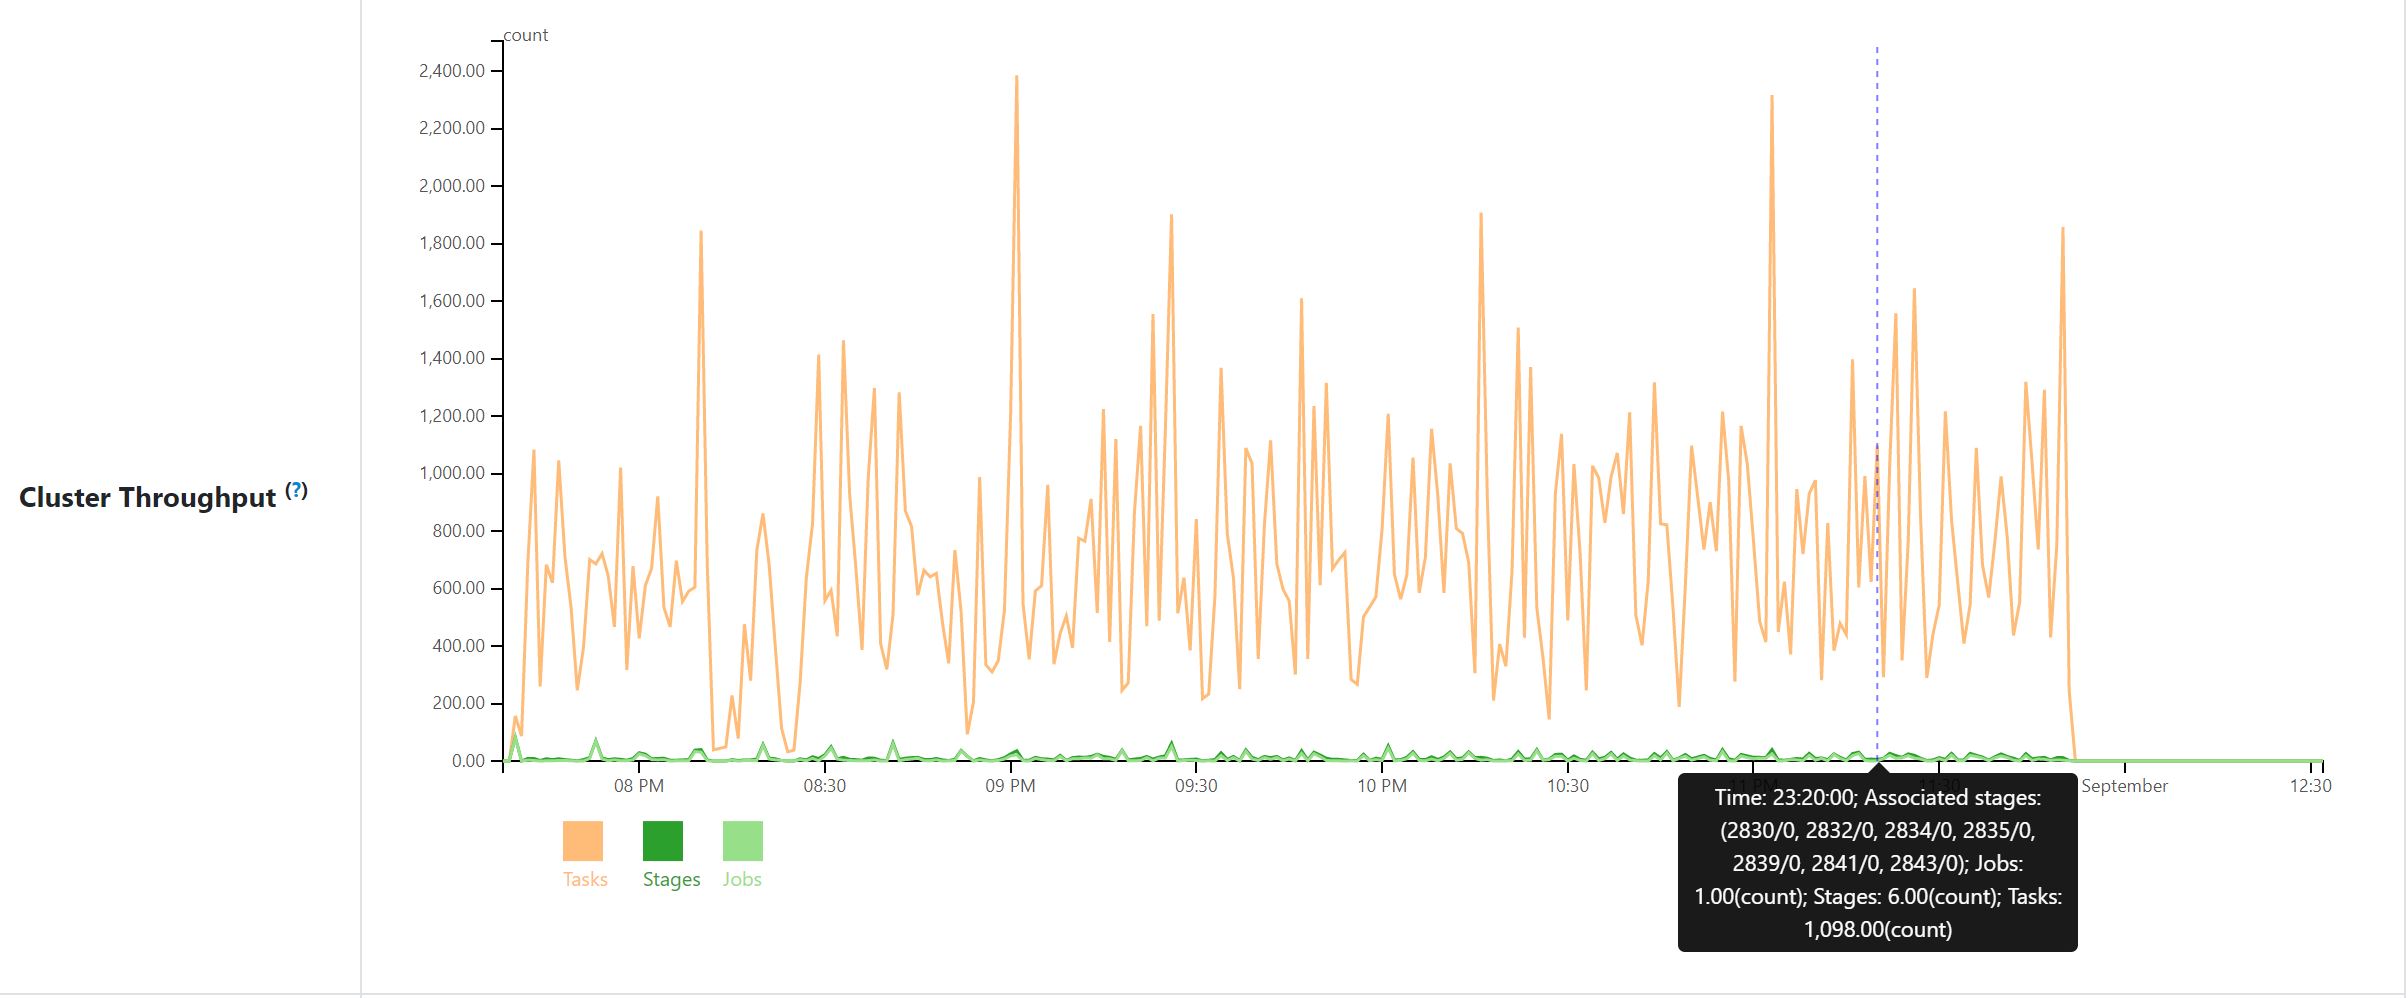
**Cluster Throughput**: sum of completed tasks, stages, and jobs per minute.
(associated stage Ids can be viewed in tool tip message.)
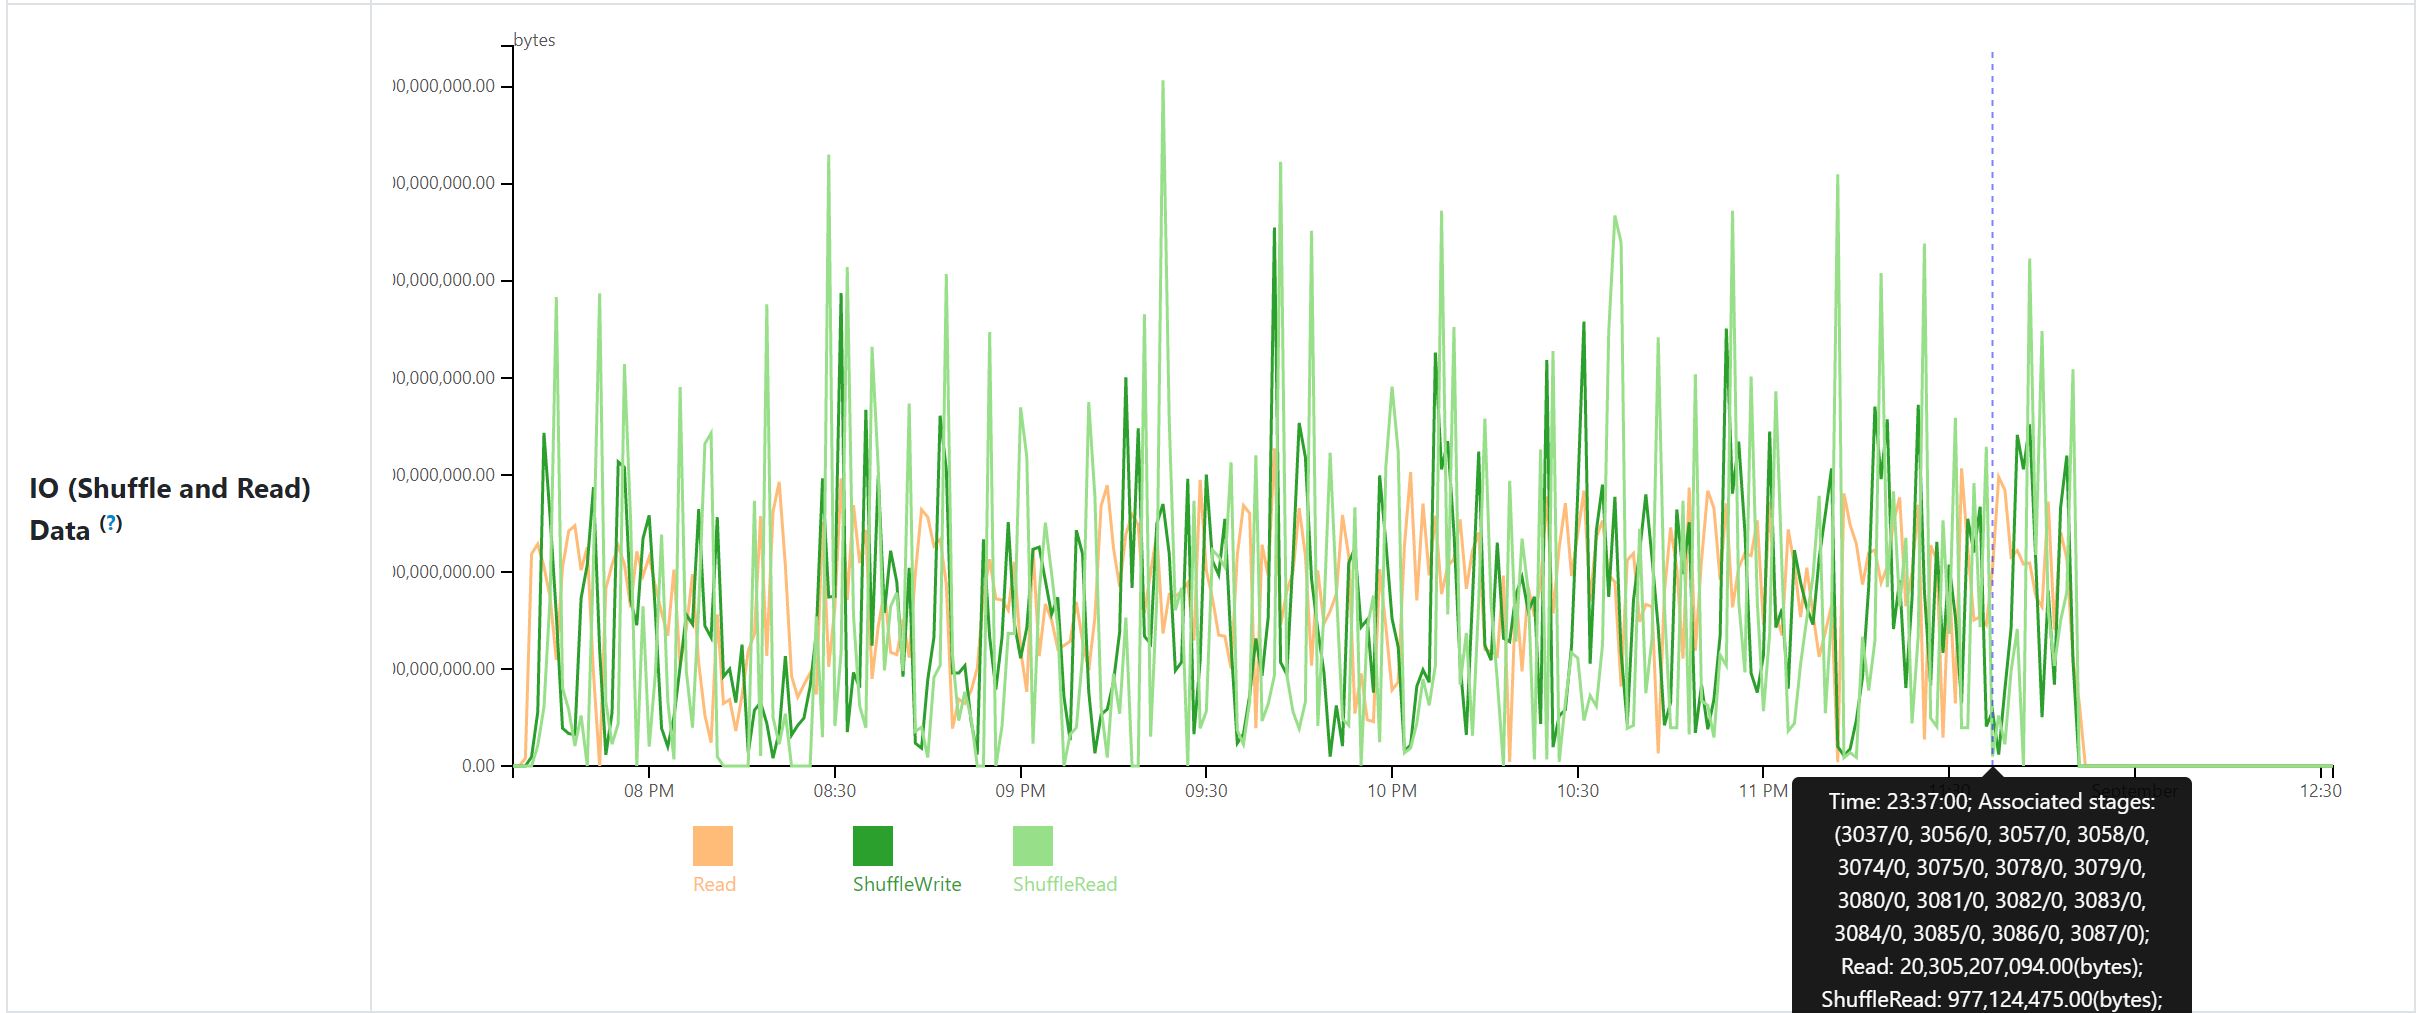
**IO (Shuffle and Read) Data**: sum of total shuffle read bytes, shuffle
write bytes and read bytes per minute.
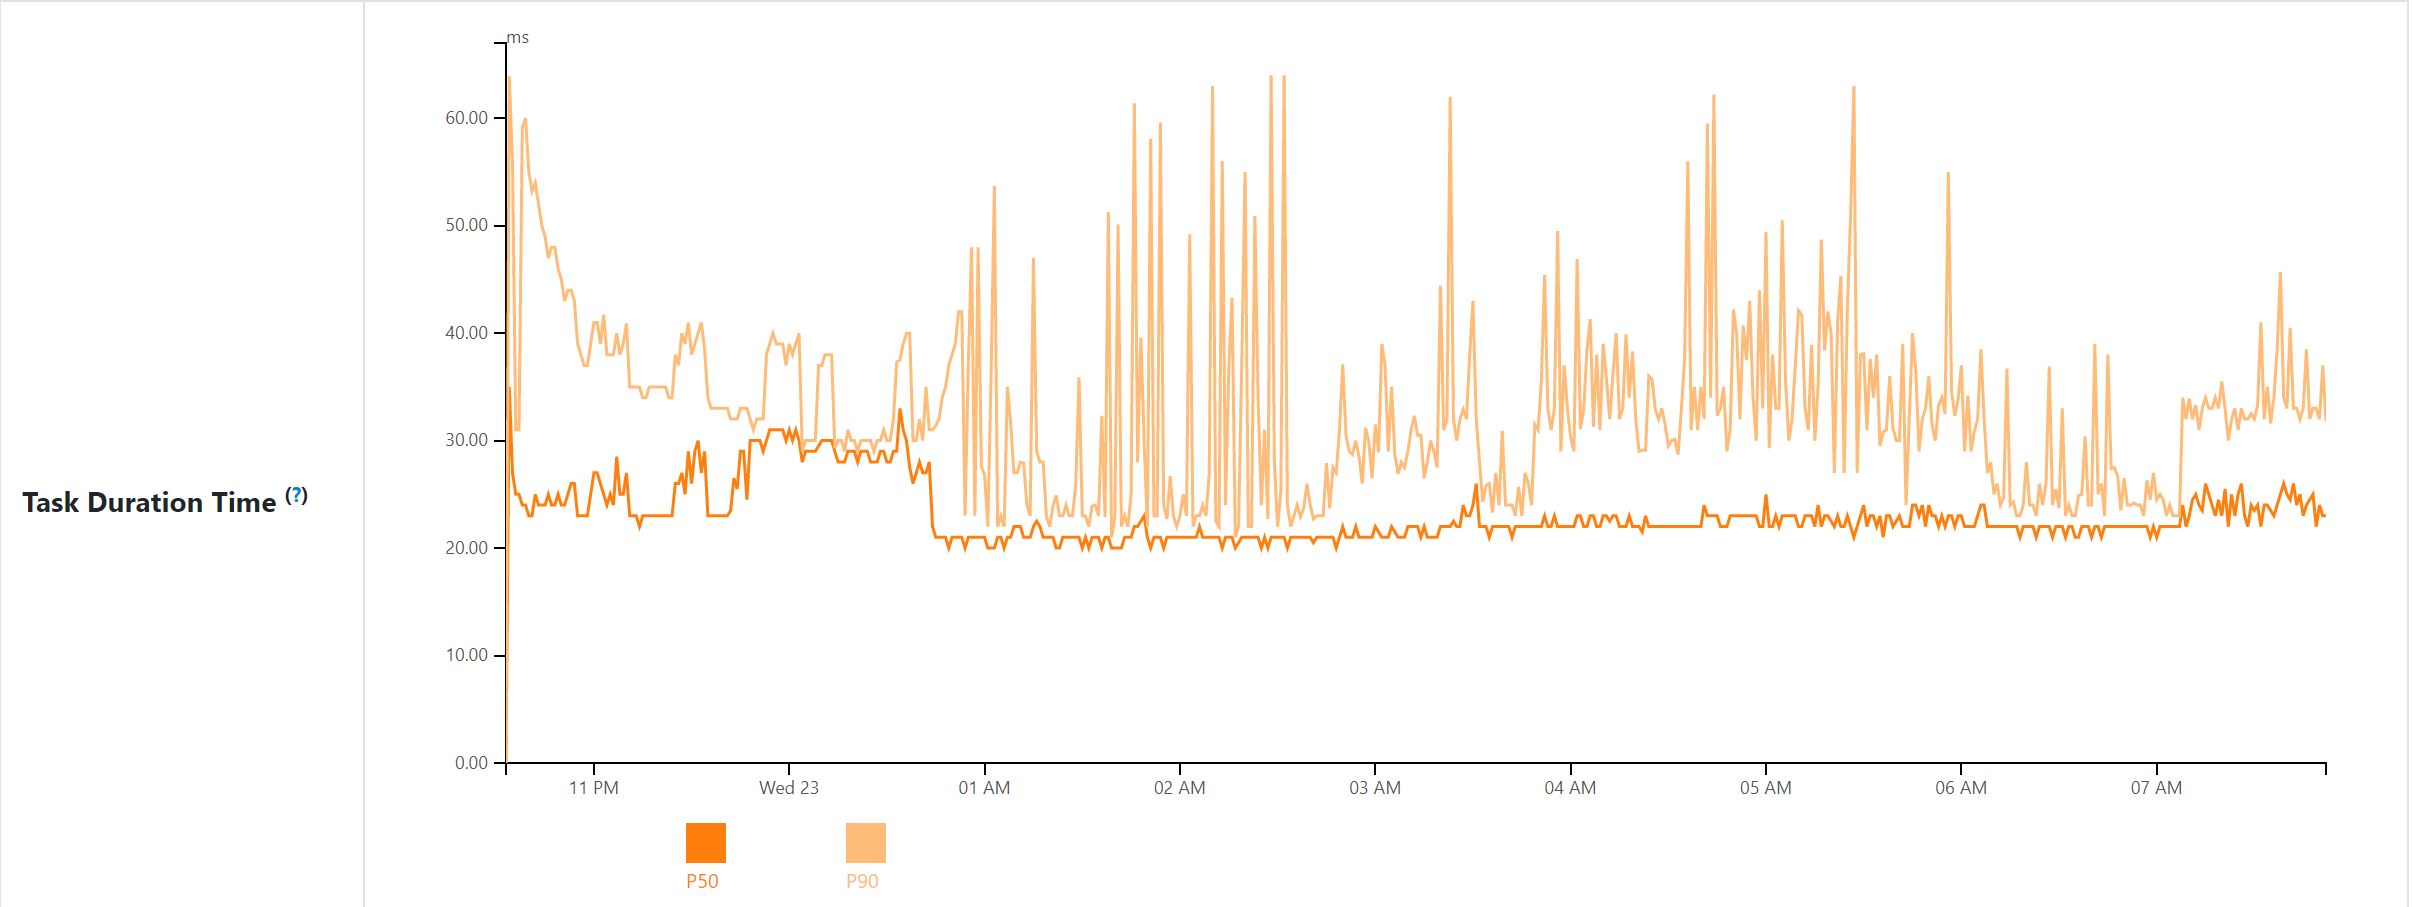
**Task Duration Time**: application level 50% and 90% percentile of task
duration per minute.
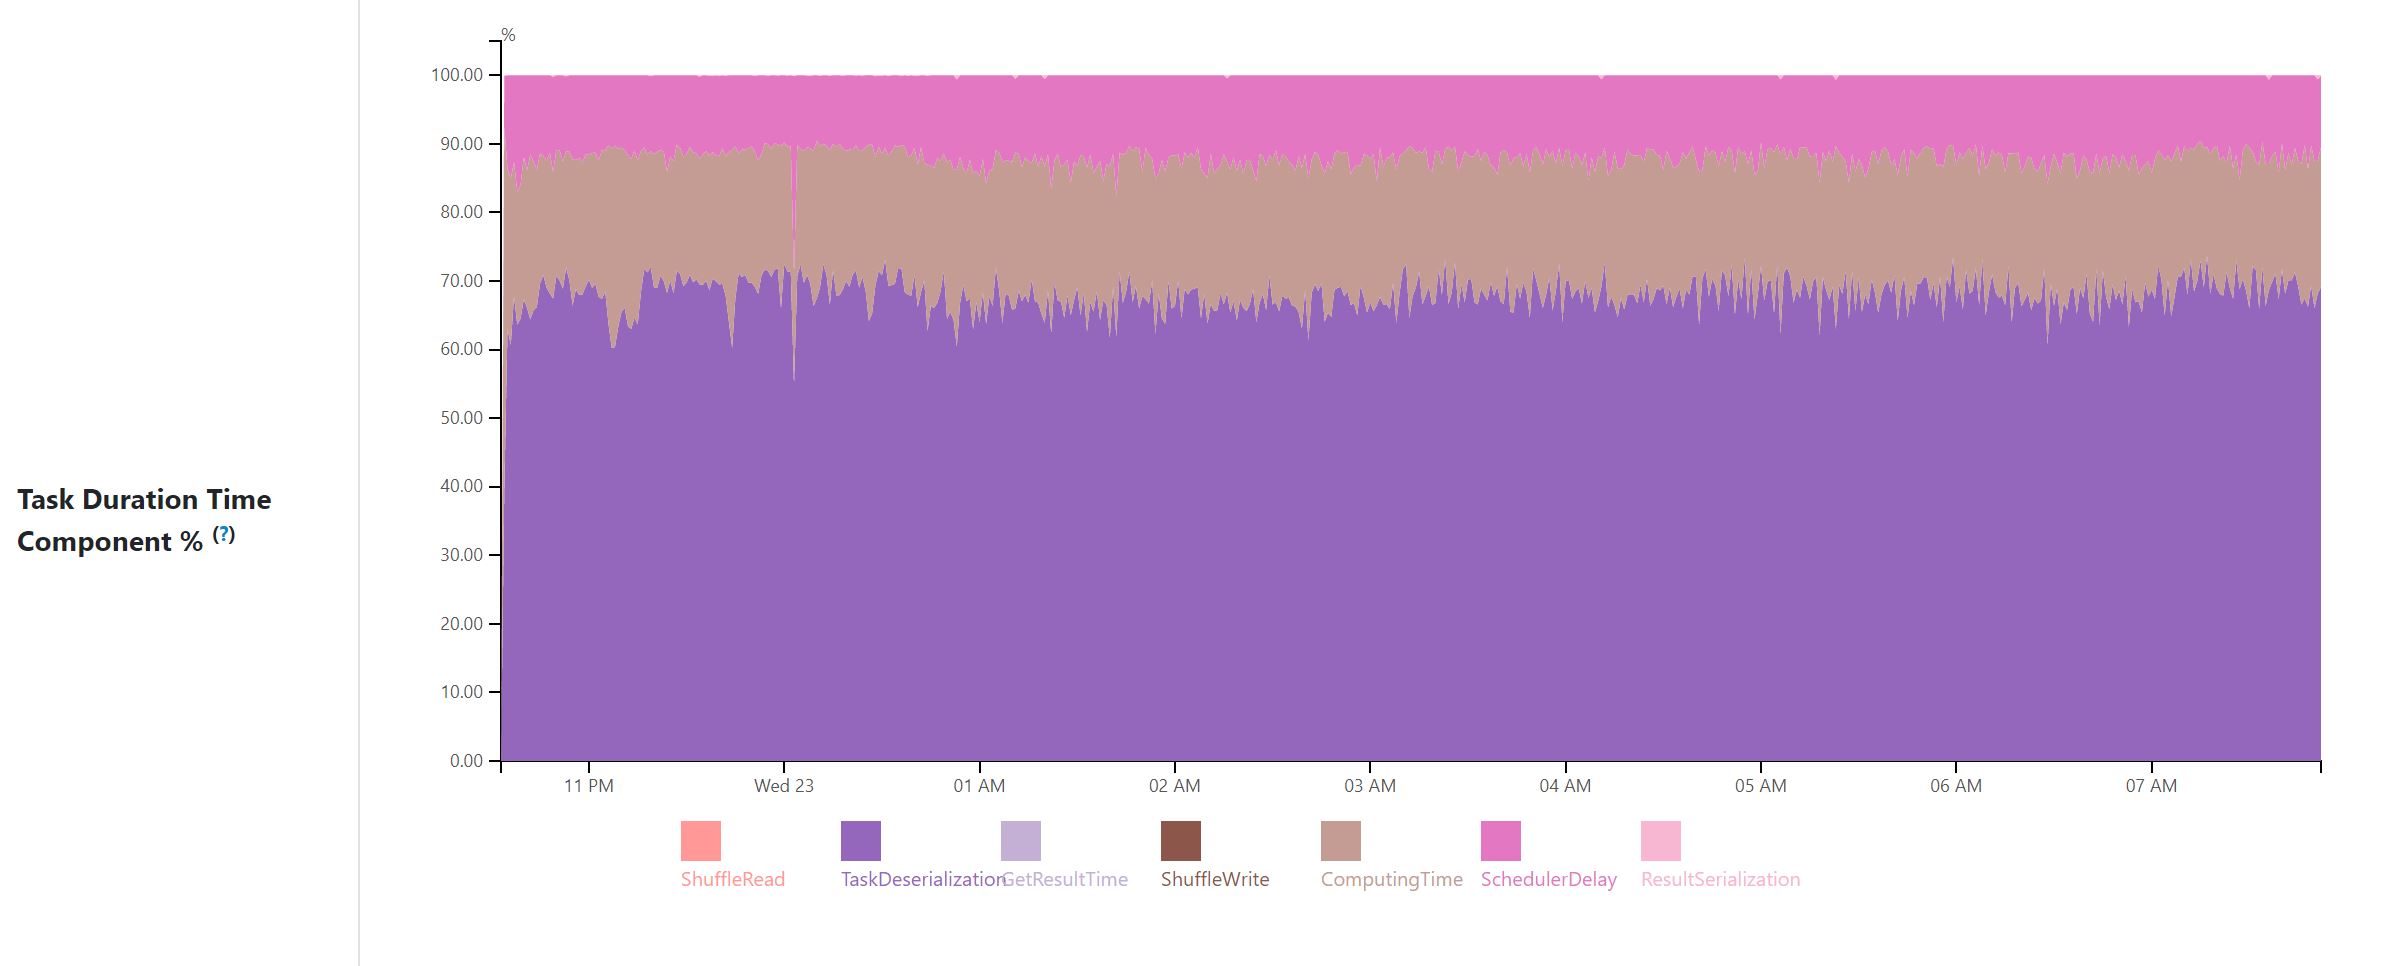
**Task Duration Time Component %**: percentage of scheduler delay, computing
time, shuffle read, task deserialization, result serialization, shuffle write,
get result time by task duration per minute.
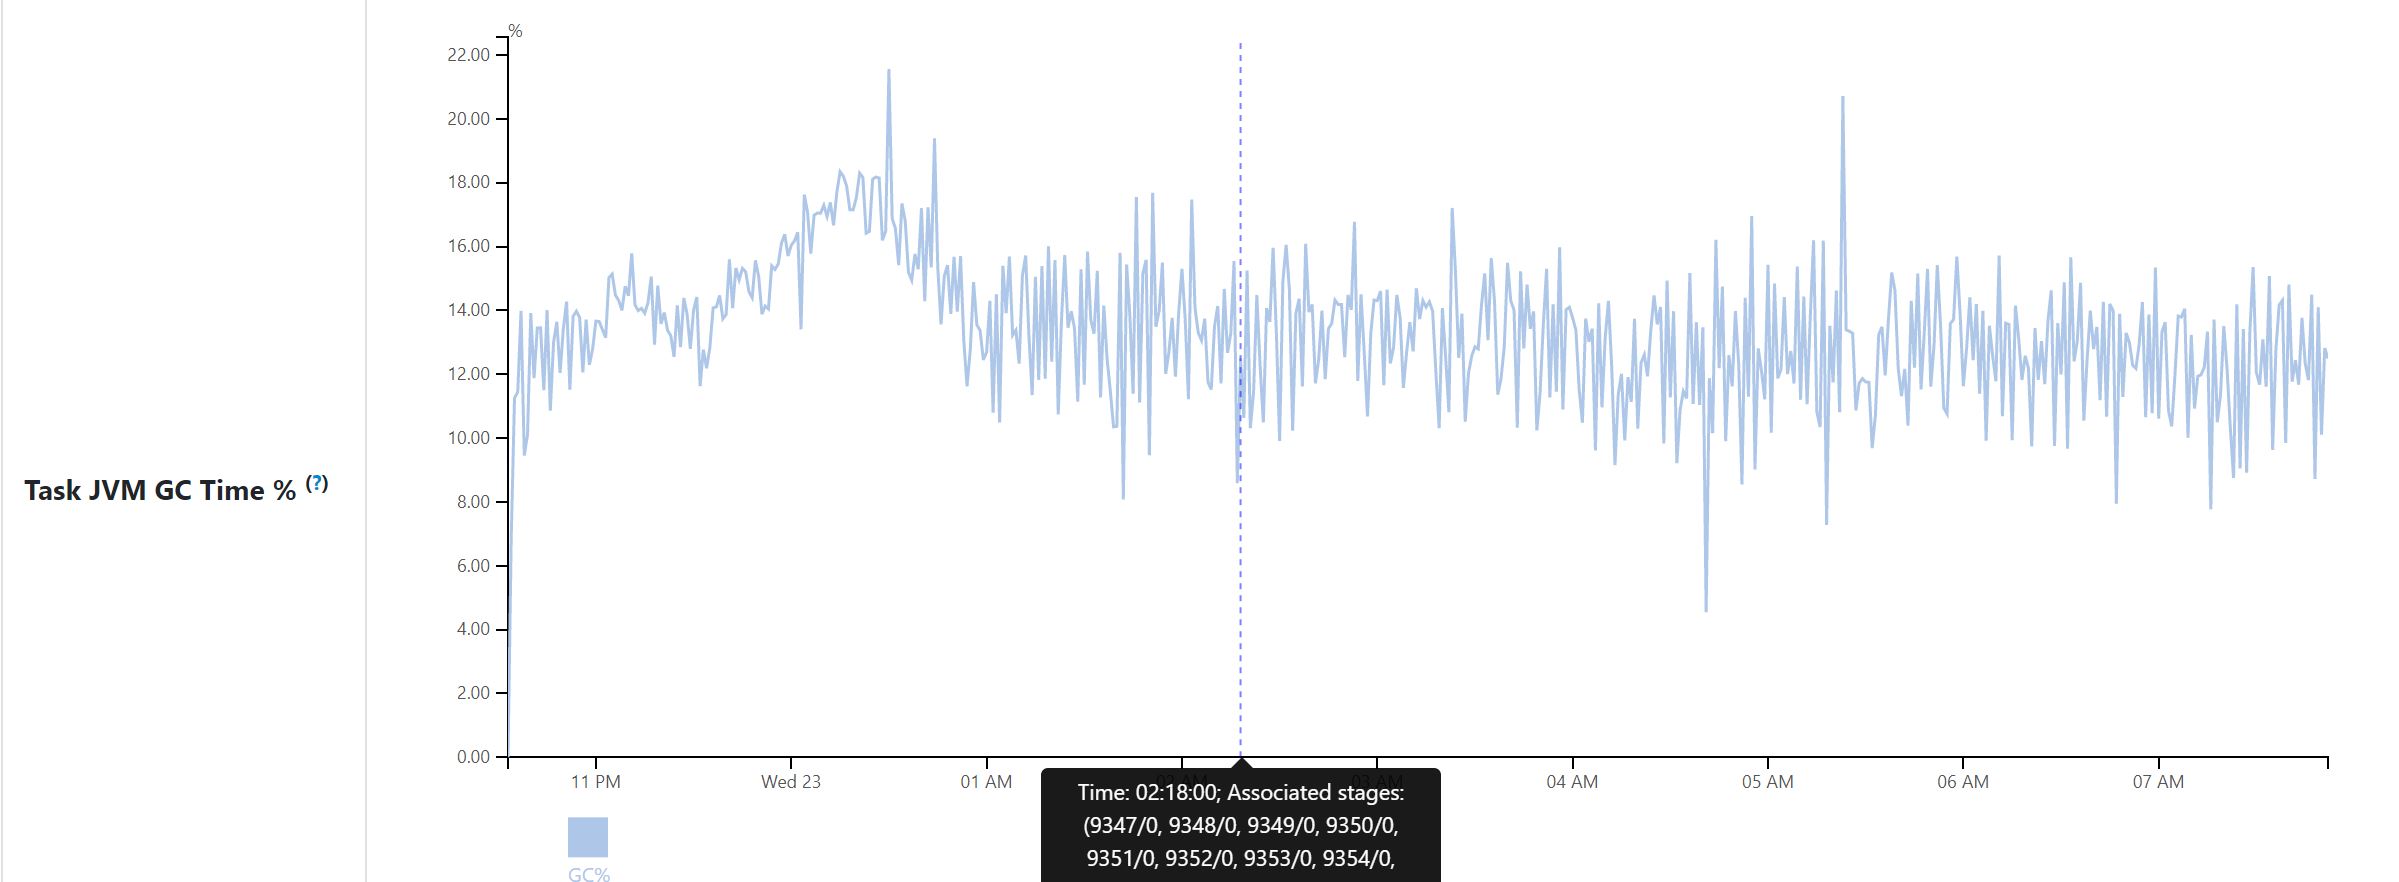
**Task JVM GC Time %**: percentage of task JVM GC time by task duration per
minute.
Application statistics page is only available in spark history server.
Aggregated data is generated when parsing event log file and store in KVStore.
Metrics data is aggregated to one data instance per minute (based on task
finish time). For example, if task a finish time is in (t1 - 1minute, t1],a's
data is added to data instance t1. This follows same approach of executors
metrics.
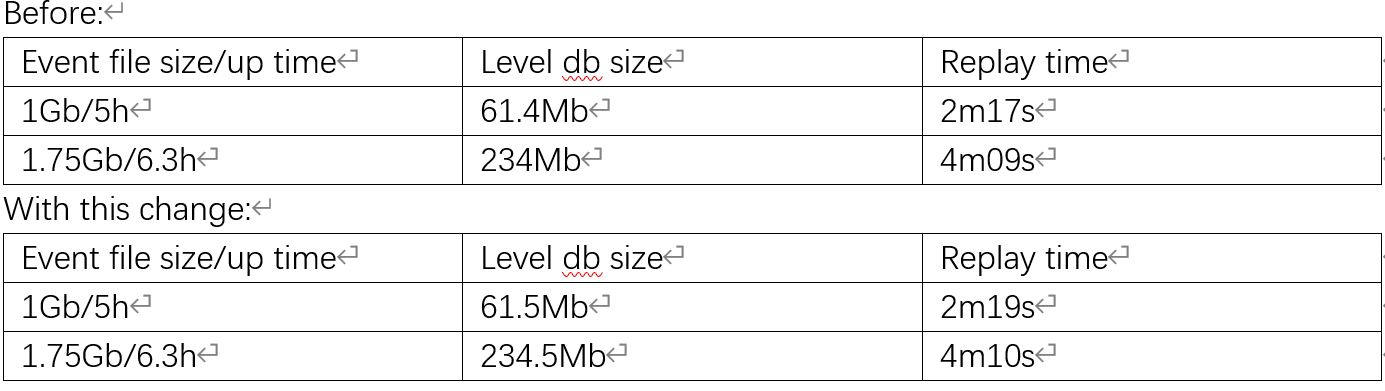
From my test there is no much increasing for kv store size and replaying
time. Here is my local test result. Impact to replay time may be little
different for different applications, but it should be too big.
### Does this PR introduce _any_ user-facing change?
<!--
Note that it means *any* user-facing change including all aspects such as
the documentation fix.
If yes, please clarify the previous behavior and the change this PR proposes
- provide the console output, description and/or an example to show the
behavior difference if possible.
If possible, please also clarify if this is a user-facing change compared to
the released Spark versions or within the unreleased branches such as master.
If no, write 'No'.
-->
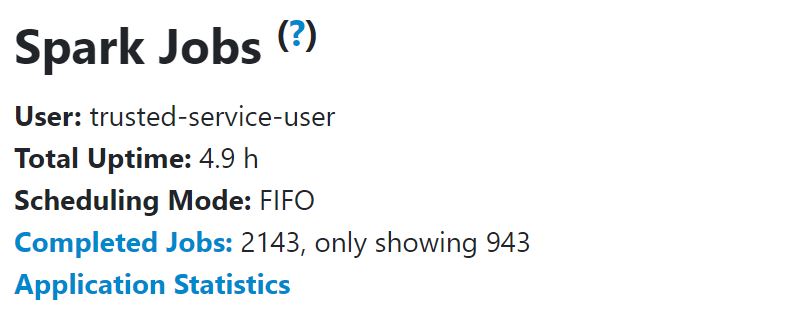
User facing change compared to master: Add application statistics page under
jobs tab and new page link in jobs page.
Entry point:
Application statistics page:
### How was this patch tested?
<!--
If tests were added, say they were added here. Please make sure to add some
test cases that check the changes thoroughly including negative and positive
cases if possible.
If it was tested in a way different from regular unit tests, please clarify
how you tested step by step, ideally copy and paste-able, so that other
reviewers can test and check, and descendants can verify in the future.
If tests were not added, please describe why they were not added and/or why
it was difficult to add.
-->
1. manual test
2. add new unit test
----------------------------------------------------------------
This is an automated message from the Apache Git Service.
To respond to the message, please log on to GitHub and use the
URL above to go to the specific comment.
For queries about this service, please contact Infrastructure at:
[email protected]
---------------------------------------------------------------------
To unsubscribe, e-mail: [email protected]
For additional commands, e-mail: [email protected]