zhli1142015 edited a comment on pull request #29908:
URL: https://github.com/apache/spark/pull/29908#issuecomment-701833414
@tgravescs , thanks for your comments. The views here are all application level. You are right, "cluster throughput" is confusing, I use this as we run spark per cluster per application in our cases, but it's not suitable for other users. i think "Execution Throughput" here is better. if tasks start and finish within a minute, it's still shown here. for example task A started and finished within (t1 - 1 min, t1], it's value is recorded in data point t1. For long application, the default time range may be hours, all the graphs support zooming in so we can select small time rang for details (but minimum interval is not changed). for shorter application, we can use smaller aggregation period (this is a config for all applications rendered in HS), i also added config for this, for example "5 seconds" as below. 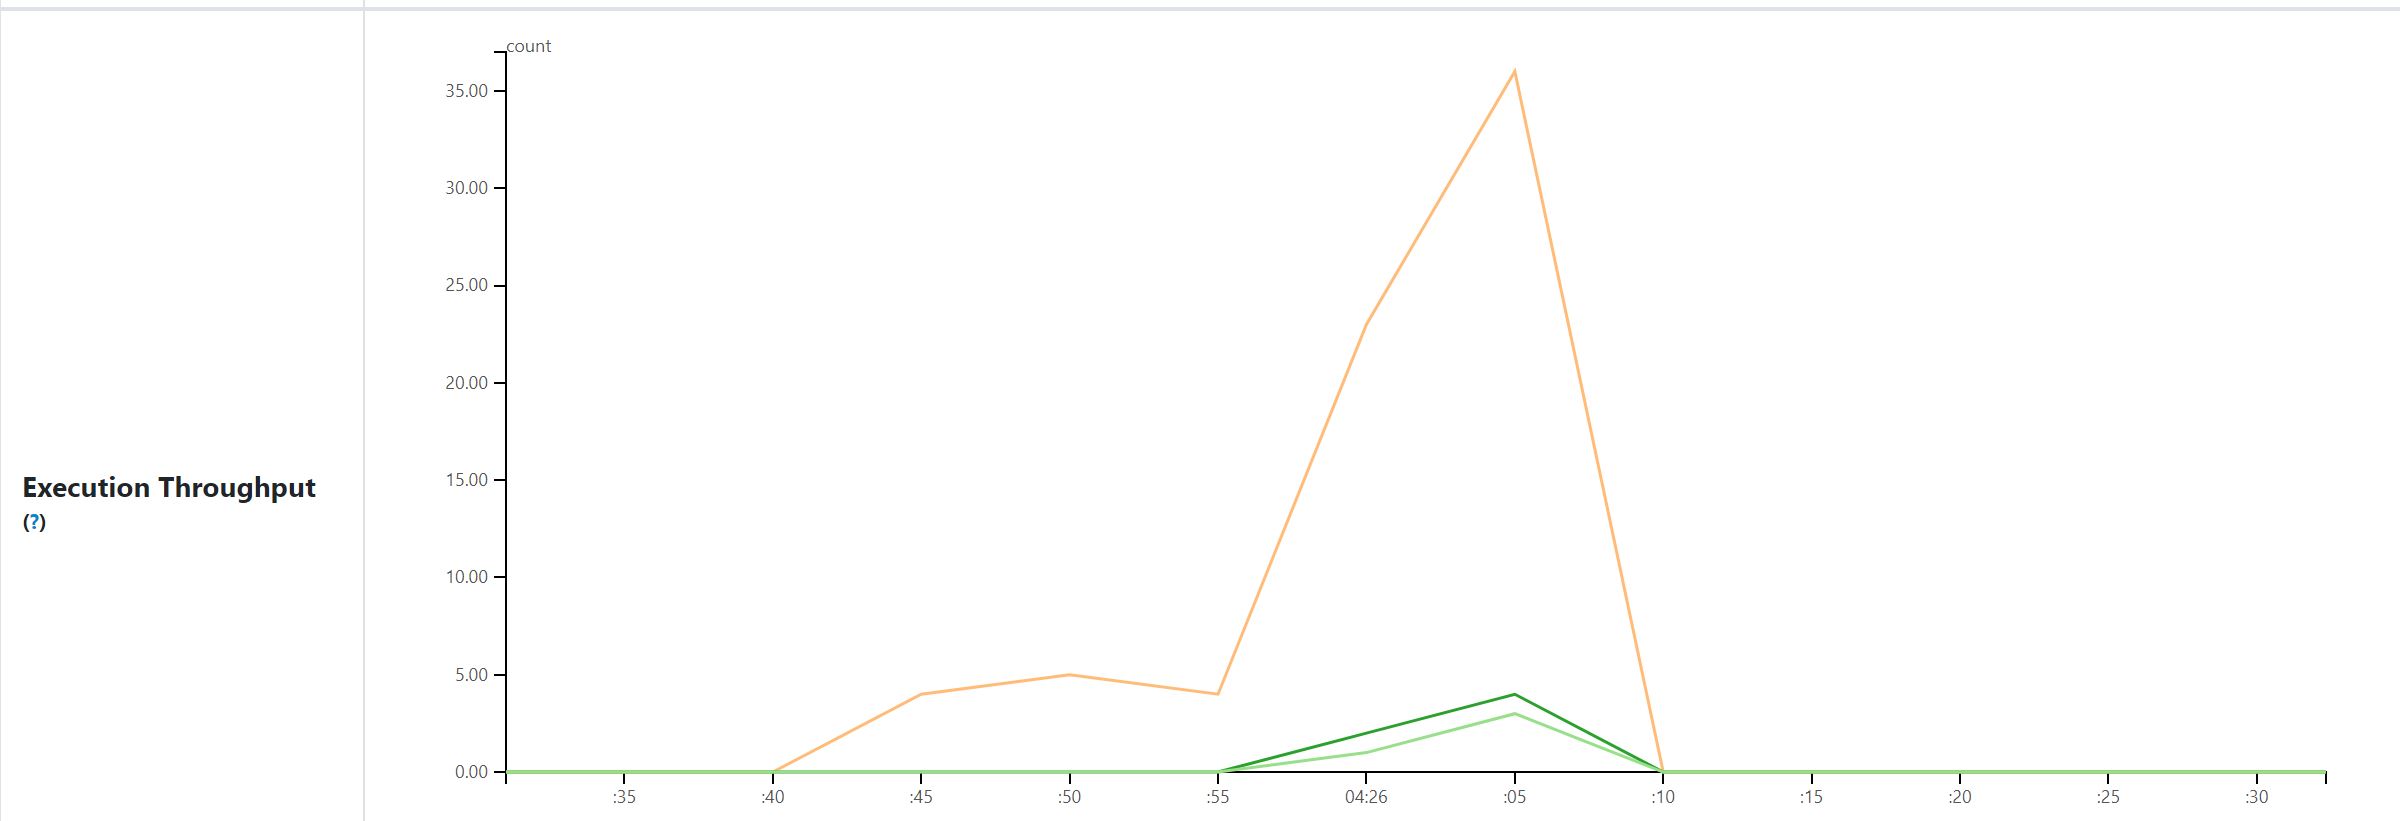 Original data is from tasks metrics in event log, views above are based on my experience about using spark, welcome to any suggestions. If any other valuable view or aggregation data / dimension in your mind, we can talk about to see if it's easy to implement. ---------------------------------------------------------------- This is an automated message from the Apache Git Service. To respond to the message, please log on to GitHub and use the URL above to go to the specific comment. For queries about this service, please contact Infrastructure at: [email protected] --------------------------------------------------------------------- To unsubscribe, e-mail: [email protected] For additional commands, e-mail: [email protected]