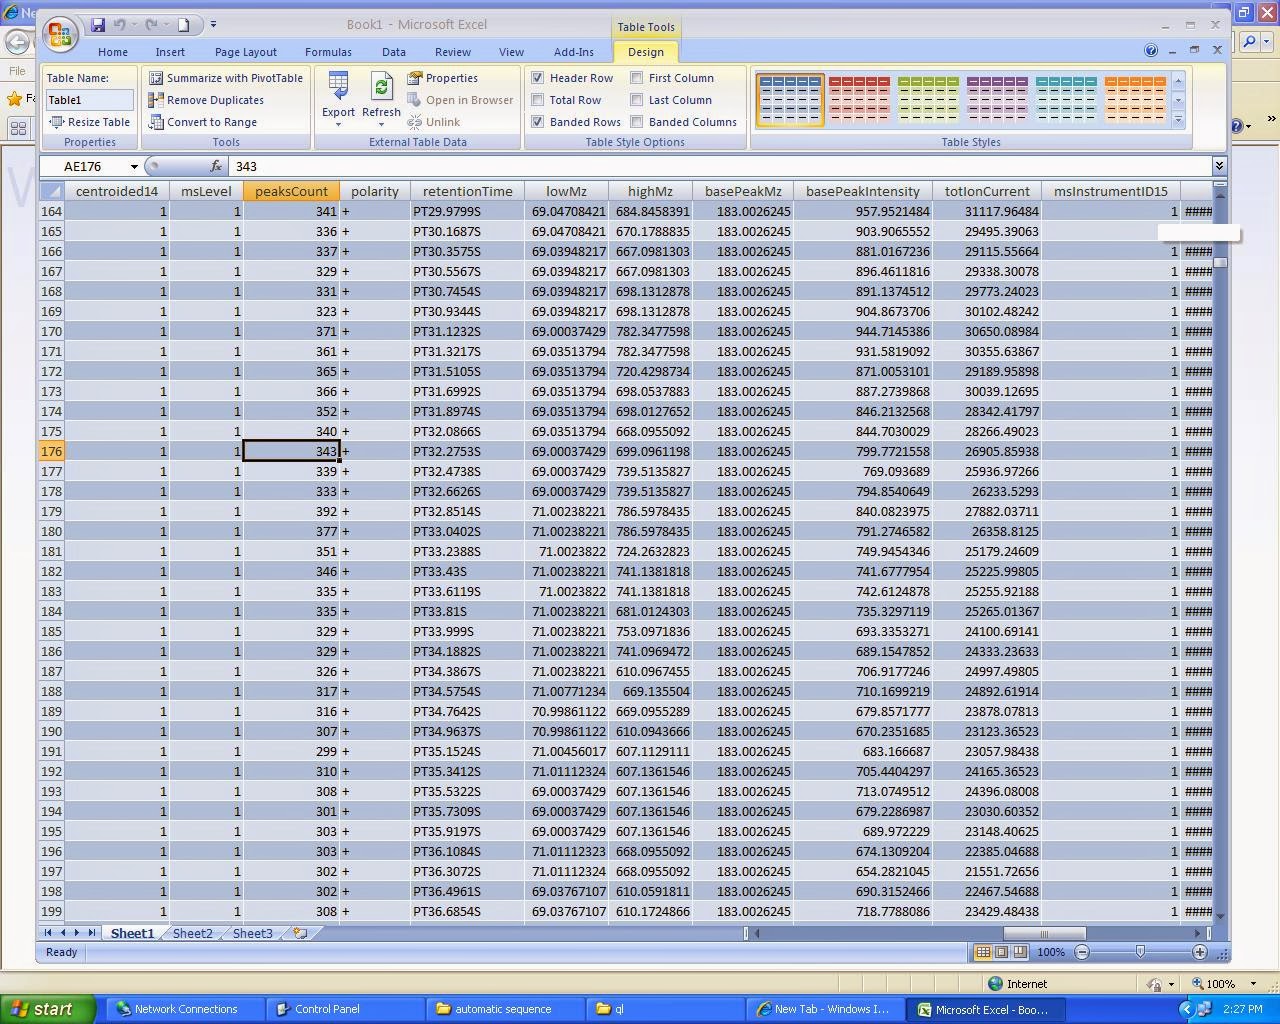
Hi All,

I want to get the intensities of peaks with a specific m/z at different
retention times from hundreds of thermo RAW files.
I have converted a RAW file into a mzxml file, and opened the mzxml file by
excel to display the xml table.
In the table, I found only the lowMz for the peak with lowest m/z, the
highMz for the one with highest m/z and the basePeakMz for the most
intensive one.
However, there should be hundreds of peaks according to the peaksCount
I put here a figure to show the displayed xml table by excel.
Is there a way to display all the counted peaks with m/z as well as the
corresponding intensities at each retention time?
Thank you very much for your help.

Best wishes

Liang


<https://lh3.googleusercontent.com/-FHaLmbBRsys/Ut_L-wAI0fI/AAAAAAAACfU/sZfM9KY3PYE/s1600/mzxml.JPG>

--
You received this message because you are subscribed to the Google Groups
"spctools-discuss" group.
To unsubscribe from this group and stop receiving emails from it, send an email
to [email protected].
To post to this group, send email to [email protected].
Visit this group at http://groups.google.com/group/spctools-discuss.
For more options, visit https://groups.google.com/groups/opt_out.