Dear Jason,

Thank you very much for the help.
I will try with your method.
Best regards
Liang
On Wednesday, January 22, 2014 5:03:34 PM UTC+1, Jason Winget wrote:
>
> Hi Liang, this is something I've been working on recently. The peak
> intensities are compressed, so you need to decompress them to generate a
> table of peaks and intensities.
> You will almost certainly want to do this with a script instead of in
> Excel.
>
> For mzXML files, I first extract all scan events, then parse the peaks
> element as follows (in python, using the base64, struct, and lxml modules):
> ----
> line = elem.xpath('mzXML:peaks', namespaces=NS)[0].text
> decoded = base64.standard_b64decode(line)
> tmp_size = len(decoded) / 8
> unpack_format = "!%dd" % tmp_size # This is important. The data is
> double-double encoded
>
> idx = 0
> mz_list = []
> intensity_list = []
> for val in struct.unpack_from(unpack_format, decoded):
> if(idx%2 == 0):
> mz_list.append(float(val))
> else:
> itensity_list.append(float(val))
> idx += 1
> ----
> This returns two lists containing the m/z values and intensities,
> respectively for each scan.
>
> For mzML, I've found it easier to use the pymzml module for python. Here
> is some code to get you started with that:
> ----
> msrun = pymzml.run.Reader(filepath)
> for s in msrun:
> if s['id'] in scans:
> for mz, i in s.peaks:
> print(mz, i)
> ----
> Hope this gets you going.
>
> Best,
> Jason
>
> On Wednesday, January 22, 2014 5:49:36 AM UTC-8, Liang QIAO wrote:
>>
>> Hi All,
>>
>> I want to get the intensities of peaks with a specific m/z at different
>> retention times from hundreds of thermo RAW files.
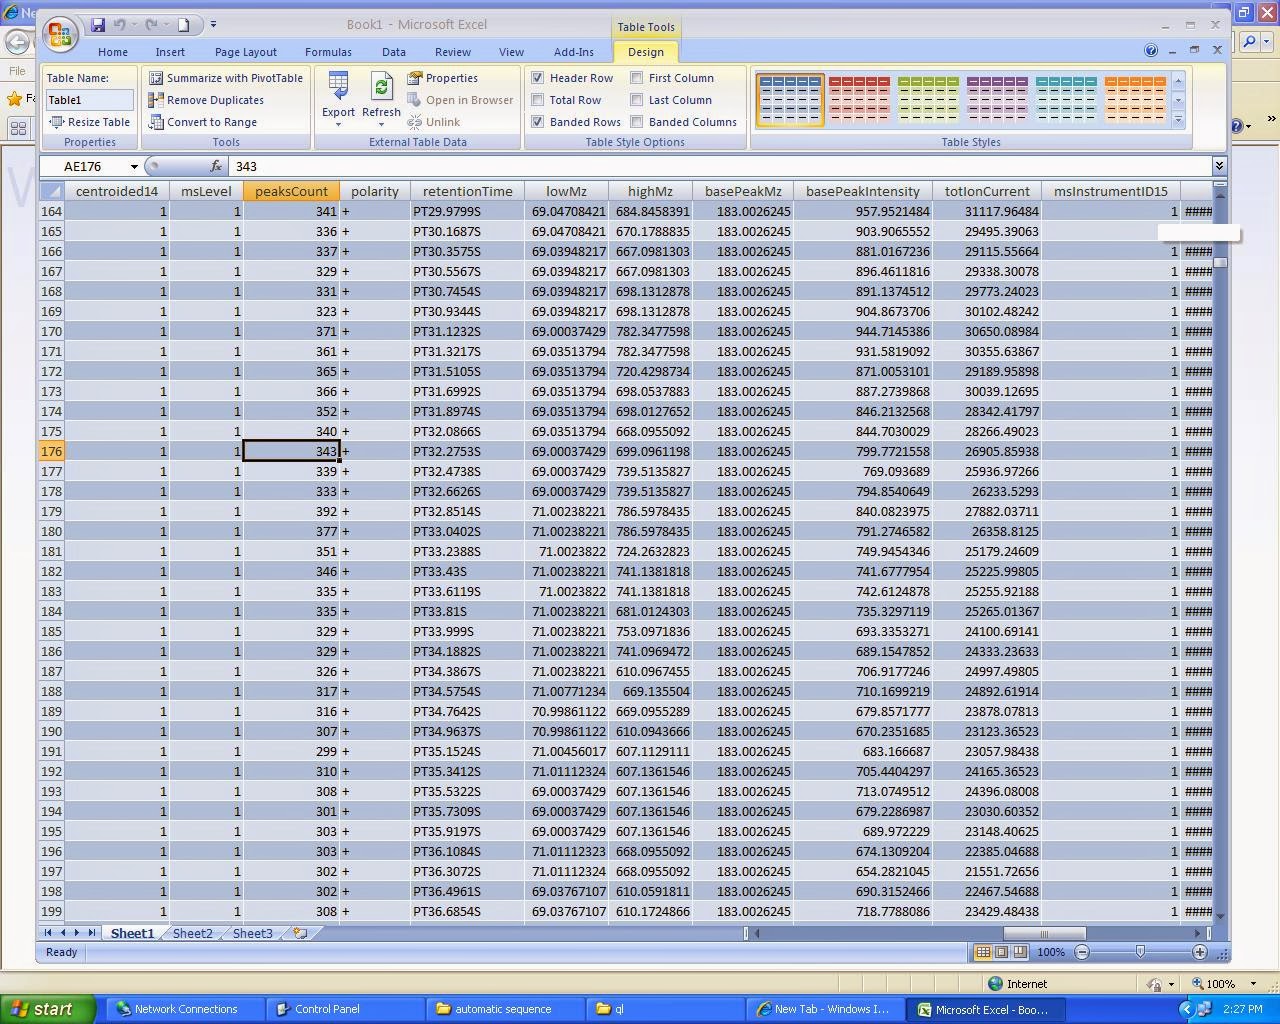
>> I have converted a RAW file into a mzxml file, and opened the mzxml file
>> by excel to display the xml table.
>> In the table, I found only the lowMz for the peak with lowest m/z, the
>> highMz for the one with highest m/z and the basePeakMz for the most
>> intensive one.
>> However, there should be hundreds of peaks according to the peaksCount
>> I put here a figure to show the displayed xml table by excel.
>> Is there a way to display all the counted peaks with m/z as well as the
>> corresponding intensities at each retention time?
>>
>> Thank you very much for your help.
>>
>> Best wishes
>>
>> Liang
>>
>>
>>
>> <https://lh3.googleusercontent.com/-FHaLmbBRsys/Ut_L-wAI0fI/AAAAAAAACfU/sZfM9KY3PYE/s1600/mzxml.JPG>
>>
>>
--
You received this message because you are subscribed to the Google Groups
"spctools-discuss" group.
To unsubscribe from this group and stop receiving emails from it, send an email
to [email protected].
To post to this group, send email to [email protected].
Visit this group at http://groups.google.com/group/spctools-discuss.
For more options, visit https://groups.google.com/groups/opt_out.