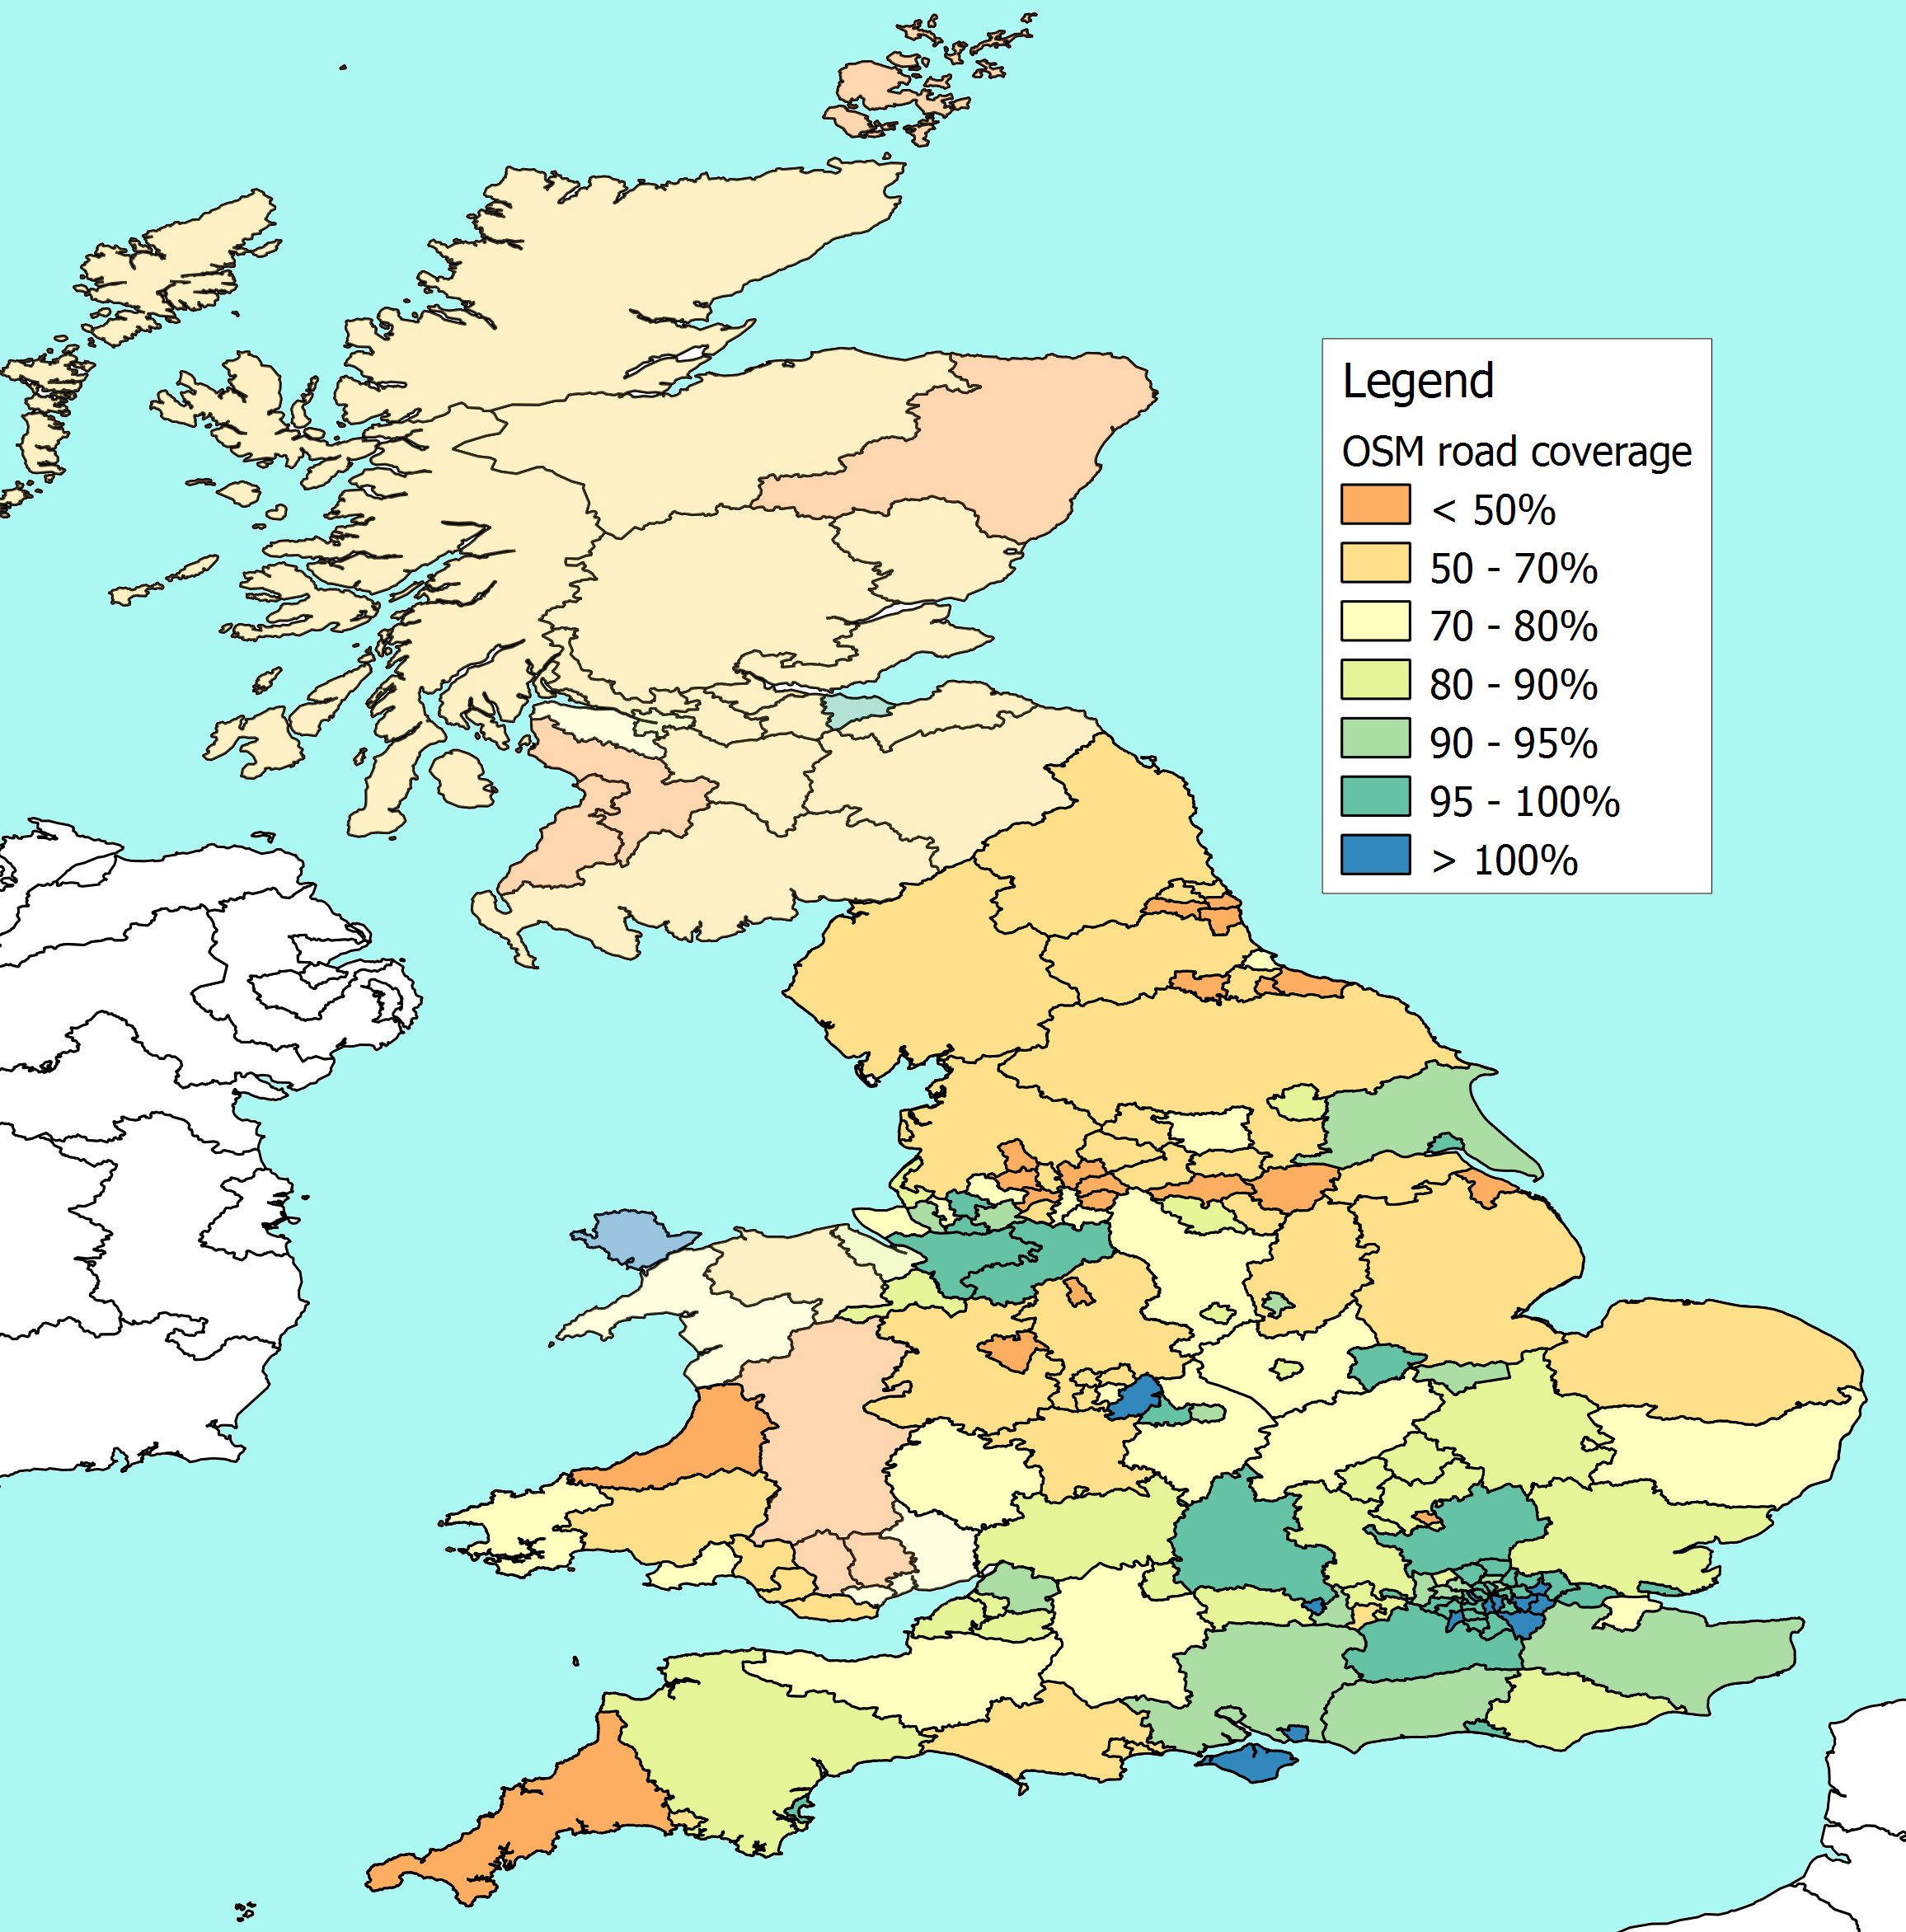
I've just posted an updated map of UK coverage at
http://www.reedhome.org.uk/Documents/OSMCover.png
There are a number of significant changes in this version:


a)      As I half suspected, there was an error in the way I was handling
map projections in the previous version. This resulted in overstating the
length of roads on OSM. I think I've now fixed this, and it seems to give
more plausible results

b)     We now have sensible looking boundaries for all the English higher
level councils (Counties, Met boroughs, London & Unitaries)

c)      In theory, all the counties should now cover the admin boundary, not
the ceremonial area. I've done some quick checks, and so far they've been OK
- though Buckinghamshire looks suspicious. Previously some unitary
authorities were counted twice, and pushed up the county figures


Buckinghamshire currently shows 117% of roads mapped. I suspect this is
something I'm doing wrong, or something wrong with the boundary,  but
haven't yet worked out what is going on. Similarly Barking and Lambeth could
be too high to be true.

Matching the road lengths to the current boundary of Cheshire and
Bedfordshire is a bit of a kludge because of the recent boundary changes.
There are better ways to handle these ,but for now they are rough
approximations.

OSM doesn't yet have decent boundaries plotted in Scotland and the parts of
Wales. I think I've figures out a way to use boundaries from the EU NUTS3
regions for an initial estimate. Most of these match local authority
boundaries, so I should be able to estimate coverage in a similar way for
most of them - I have the data, but I've not processed it yet.


Bearing in mind that these are initial results, with plenty of scope for
errors, and not much checking yet......


The lowest levels of coverage seem to be in :


North-East Lincs (24%)

Oldham (28%)

Tameside (32%)

Luton (35%)

S. Tyneside (37%)

Sunderland (38%)

Bolton (38%)

Barnsley (39%)


The highest levels of coverage (apart from Bucks, which I suspect is faulty)
are in:


Barking & Dagenham

Lambeth

Greenwich

Isle of Wight

Bexley

Kingston on Thames

Bromley

Birmingham

Reading

Portsmouth

Southwark

City of London

Kensington & Chelsea


(all of these come out just above 100%)


Luton (at 35%) and Bracknell (at 61%) stand out as the lowest coverage in
the South-East.


I'll upload more detailed figures later. Thanks for all the comments so far.
_______________________________________________
Talk-GB mailing list
[email protected]
http://lists.openstreetmap.org/listinfo/talk-gb