Hi

This brings in another subtle but significant issue.
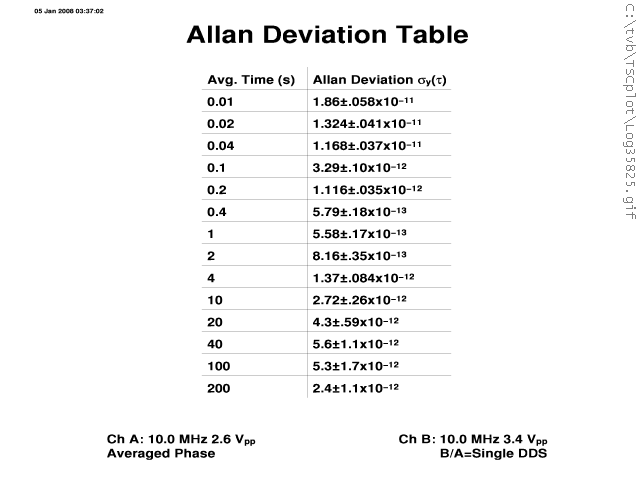
We talk about the ADEV being done as the standard deviation of the frequency
differences, but often that's not what's done. Even with zero dead time,
there's another bit of magic in there. Drift is removed before the samples
are used.

Oddly there are multiple approaches to drift removal. It comes as no
surprise that the more aggressive the drift removal, the better looking the
result. If you are looking at ADEV, it's always worth asking if (and how)
the drift was removed.

Of course there's also pre-filtering as a function of Tau, but that's even
more exotic.

Bob

-----Original Message-----
From: [email protected] [mailto:[email protected]] On
Behalf Of Magnus Danielson
Sent: Tuesday, August 16, 2011 12:23 AM
To: [email protected]
Subject: Re: [time-nuts] frequency stabilty question

On 15/08/11 18:43, Tom Van Baak wrote:
> Correct. Some ADEV plots conveniently include error bars so
> the effect of sample count on confidence is in your face. The
> TSC 5110 does this. See for example:
> http://leapsecond.com/pages/gpsdo/log35824v.gif
> http://leapsecond.com/pages/gpsdo/log35825v.gif
>
> There are also a number of modern variants on regular old Allan
> deviation that improve confidence even given the same sample
> count. In some cases the trade-off here is computation time.

I've spent some time in the Allan deviation article to numerical freedom
and confidence intervals. Also, today can Allan deviation be considered
more of a statistical scale rather than a particular algorithm. Already
within the Allan deviation there are some algorithmic differences, but
Hadamard, Total and Theo algorithms bring in different approaches on the
same scale, with the same statistical bias properties but with improved
statistical confidence intervals.

It is highly educating to see the realtime updates of TimeLab for
instance as it gathers more data. You can see how the upper end swings
wildly as data comes in, but for a particular tau the amplitude of the
swing lowers and becomes more and more subtle. This is the result of the
statistical properties of degrees of freedom and the effect on
confidence intervals in action.

The algorithmic advances is about to give as tight confidence interval
as possible for as short measurement time as possible, and the basic
trick is to use overlapping estimations in combination with "over the
edge" analysis. The Total analysis mirrors the data-sequence around the
edge to create a three-times longer sequence, but to avoid biases the
sequence is frequency corrected first, or else the unwrapping would
introduce false systematic noise. This could be due to low-frequency
noise or systematic effects of lower frequency than the sequence allow
for analysis, since it is a finite sequence of data... a key limitation
which is easilly forgot. The noise isn't white for longer times... which
is what causes us to go into the statistical predictor efforts of Allan
deviation and friends.

No, this isn't an easy topic, it took decades to learn and develop for
the professional researchers... and the work keeps progressing. It is
also a re-occurring discussion here.

Hopefully the Allan deviation article can get you up to speed...

Cheers,
Magnus

_______________________________________________
time-nuts mailing list -- [email protected]
To unsubscribe, go to
https://www.febo.com/cgi-bin/mailman/listinfo/time-nuts
and follow the instructions there.


_______________________________________________
time-nuts mailing list -- [email protected]
To unsubscribe, go to https://www.febo.com/cgi-bin/mailman/listinfo/time-nuts
and follow the instructions there.