On Tue, 2010-01-12 at 12:37 -0500, Doug Henwood wrote:
> On Jan 12, 2010, at 12:31 PM, Gernot Koehler wrote:
>
> > Dean Baker's recent report on the US employment situation mentions
> > an overall EPOP (employment-to-population ratio) of 58.2 percent.
> > How is that ratio defined in US statistics? Is it (1) employment
> > over entire population? (2) employment over adult population (15+)?
> > (3) employment over working age population (15-65)? (4) other?
> > Probably not (1) - for that definition i have the figure of 47.3
> > percent for 2003.
> > Can someone please clarify
>
> Civilian noninstitutional population over the age of 16. That is, not
> in the military, prison, or a mental institution. It's not capped at
> 65 because plenty of people over the age of 65 still work.
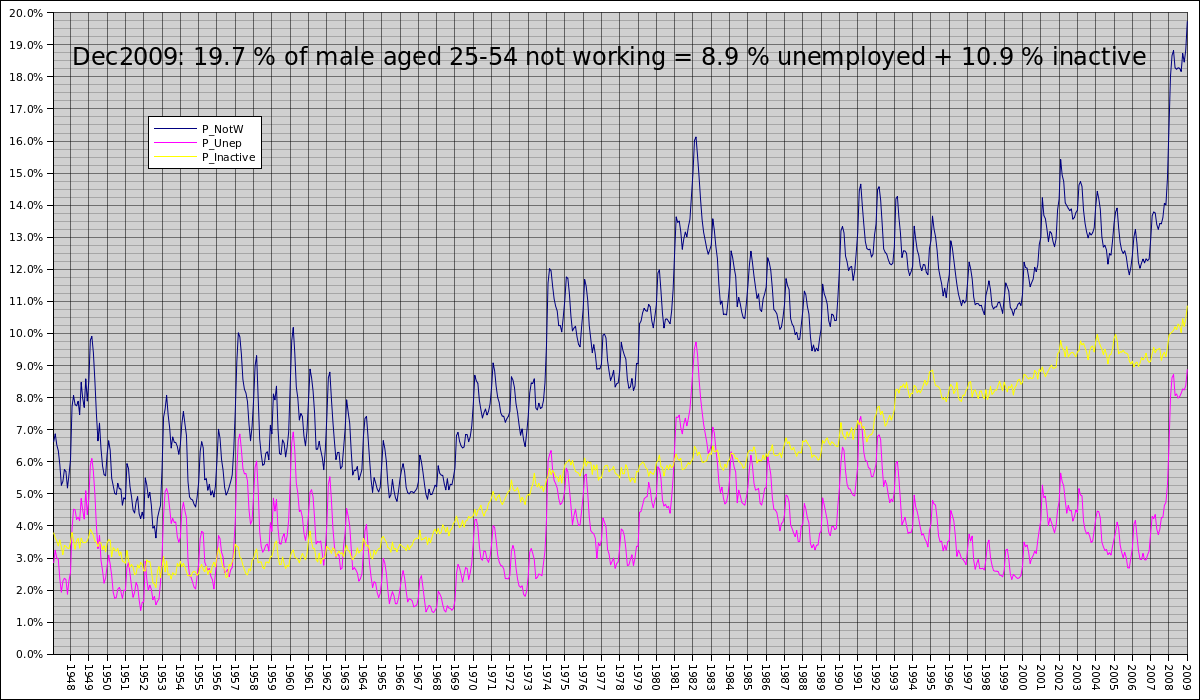
Hi,

And for a better picture of the work market use men 25-54 year old
category from BLS, a 1948-2009 graph here:

http://guerby.org/images/bls-men-25-54-200912.png

Last point is 19.7% not working in december 2009: 12.2 millions men aged
25-54 out of 62.1 millions civilian non institutional population. If it
follows usual seasonal patterns it will climb in january and february
above 20%.

I didn't graph the "part time" jobs (under 35 hours/week) but the serie
starts in 1986 around 4% and peaks in december 2009 (last point) at 6.5%
of population for male 25-54.

Also women 25-54 not working is 30.9% in december 2009: 19.6 millions
women aged 25 to 54 out of 63.5 millions. It's the not working level of
march 1988 for this population.

Laurent


_______________________________________________
pen-l mailing list
[email protected]
https://lists.csuchico.edu/mailman/listinfo/pen-l