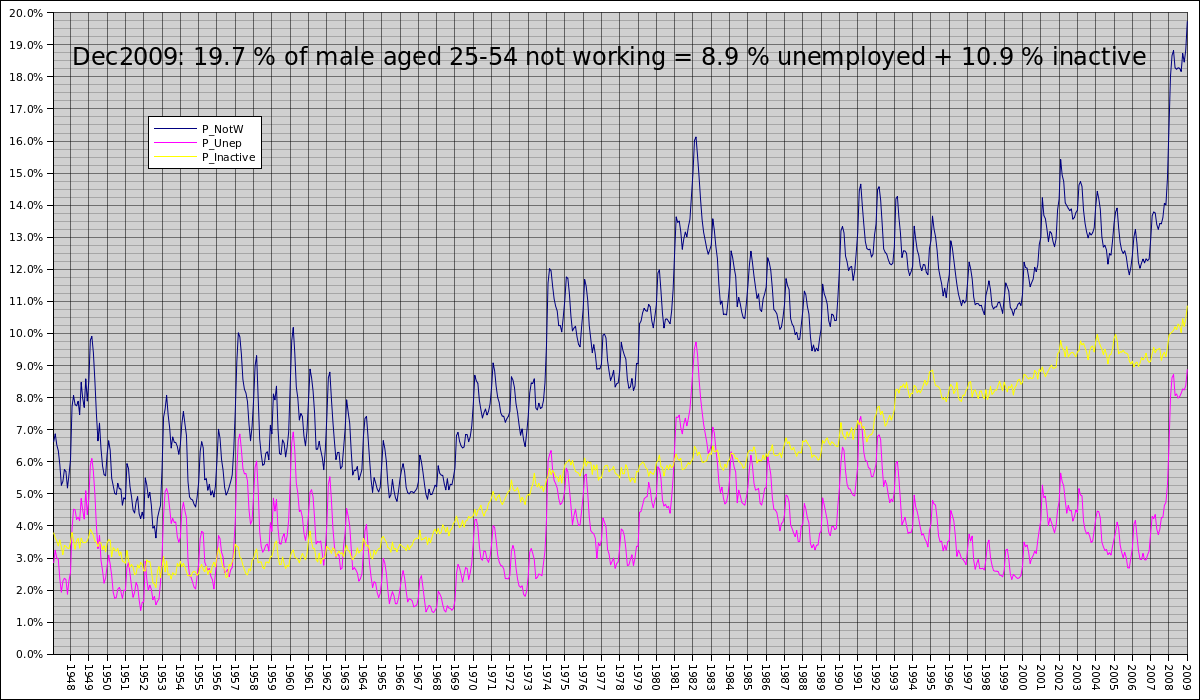
On Tue, 2010-01-12 at 13:23 -0800, Jim Devine wrote:
> Laurent GUERBY wrote:
> > And for a better picture of the work market use men 25-54 year old
> > category from BLS, a 1948-2009 graph here:
> >
> > http://guerby.org/images/bls-men-25-54-200912.png
> >
> > Last point is 19.7% not working in december 2009: 12.2 millions men aged
> > 25-54 out of 62.1 millions civilian non institutional population. If it
> > follows usual seasonal patterns it will climb in january and february
> > above 20%.
>
> some economists say that the US "inactive" male population (as a
> percentage of the total) has been rising because of the disability
> insurance program. What do you think?
If you're thinking of this paper:

http://econ-www.mit.edu/files/579

For reference it was the only paper cited in answer to my query about
the huge inactivity rate trend over 1948-2008 sent to more than
20 economists blogger. Here is what I answered at the time:

<<
After a first reading and if I did not misinterpret, the paper looks at
1978-1998 period with 1984 as reference of a change in legislation and
ends up with a numerically low effect: 0.5% on unemployment measure.
Other factors are cited (like on my blog) but not analyzed
quantitatively.

If you look at the 1948-2008 data as I did you'll notice quickly that
1960-1984 and 1984-2008 (to take an equal number of years on both side
while retaining the maximum data) see the exact same increase in the
inactive population, +3 points for the first period from 3% to 6% and
then again +3 points from 6% to 9%, both in 24 years.

I of course don't have references on legislative changes related to
disabilities on the 1960-1984 period, but the data above confirm that
the 1984 change is very low impact, if not null on the big picture of
the inactive population evolution.

If you know about other references on this topic, and/or if you could
give more visibility to this data piece I'd be very grateful (as I said
I'm not looking for a link to my blog so feel free to cite without link
or attribution).
>>

Now if you look at the inactivity curve periods of increase in
inactivity rate seems to correlate with wars: 1965-1975 = Vietnam,
1990-1993 = Gulf, but the latest increase starts in 1999 and Iraq is
2003 and seems to mark a temporary halt in the increase so contrary to
other wars. Possible explanation: 25 year old Vietnam soldier became
inactive in 1975 after the war, 54-25=29 and 1975+29=2004 so this
population starts to drop out the 25-54 year old category, this might
explain part of why the rate stays flat in 2002-2008 (WWII veterans
dropping out might also explain some parts of the earlier curve). The
two wars increases are around 2.5% each, so around 1.5 millions people,
I don't know where to find the number of veterans from each war.

But this does not explain why no peer-reviewed economics literature
exist about this story, and about the life of 10.9% the prime aged male
population :).

Laurent


_______________________________________________
pen-l mailing list
[email protected]
https://lists.csuchico.edu/mailman/listinfo/pen-l