Sent: Monday, October 27, 2014 12:57:38 PM
My analysis of IR calorimetry and Black Body radiation is here :
http://lenr.qumbu.com/blackbody_141027A.php
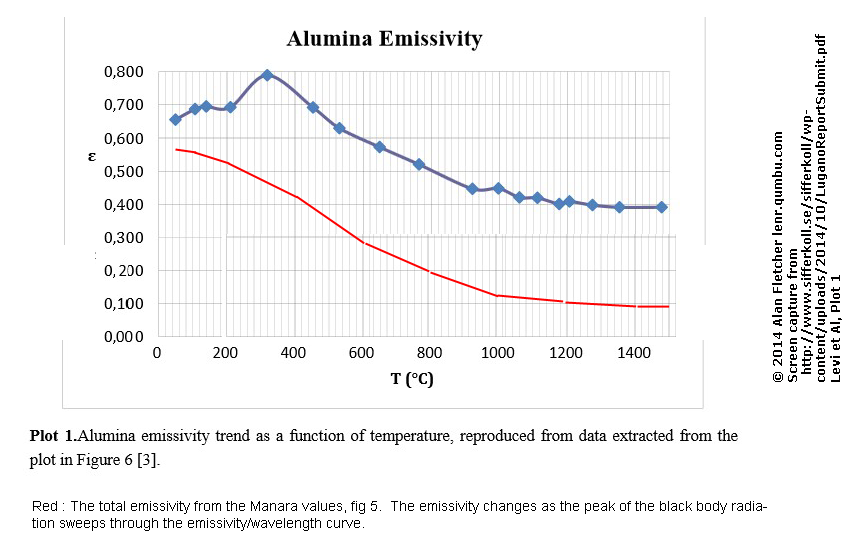
Slightly updated.

I used my blackbody calculator to derive an emissivity/temperature curve
similar to Lugano fig 2.

I swept the temperature form 100 to 1400, with emissivity=1, and deduced the
average emissivity as Planck/StefanBoltzman using Manara's fig 5 data.

The result is at
http://lenr.qumbu.com/web_hotcat_pics/141022_lugano_02_manara.png

Basically what happens is that as the temperature changes the peak of the
blackbody spectrum moves through different parts of the emissivity/wavelength
curve.

The overall shape of the Lugano emissivity/temperature curve, other than the
peak at 300C, is very similar to the Manara curve, so it could also be the
result of a wavelength dependency.
(Manara also shows a temperature dependency, but I didn't attempt to model that
-- I just used the 1050K/770C curve).

This increases my confidence that the calibration at 400C could still be at
least qualitatively valid at 1400C