Robert,

Your references are a bit old.  The data in the graph I gave is the
data for minimum extent thru 2008 and came from a US CCSP report.  The
graph is an updated version (including 2008) of the one in the
original reference:
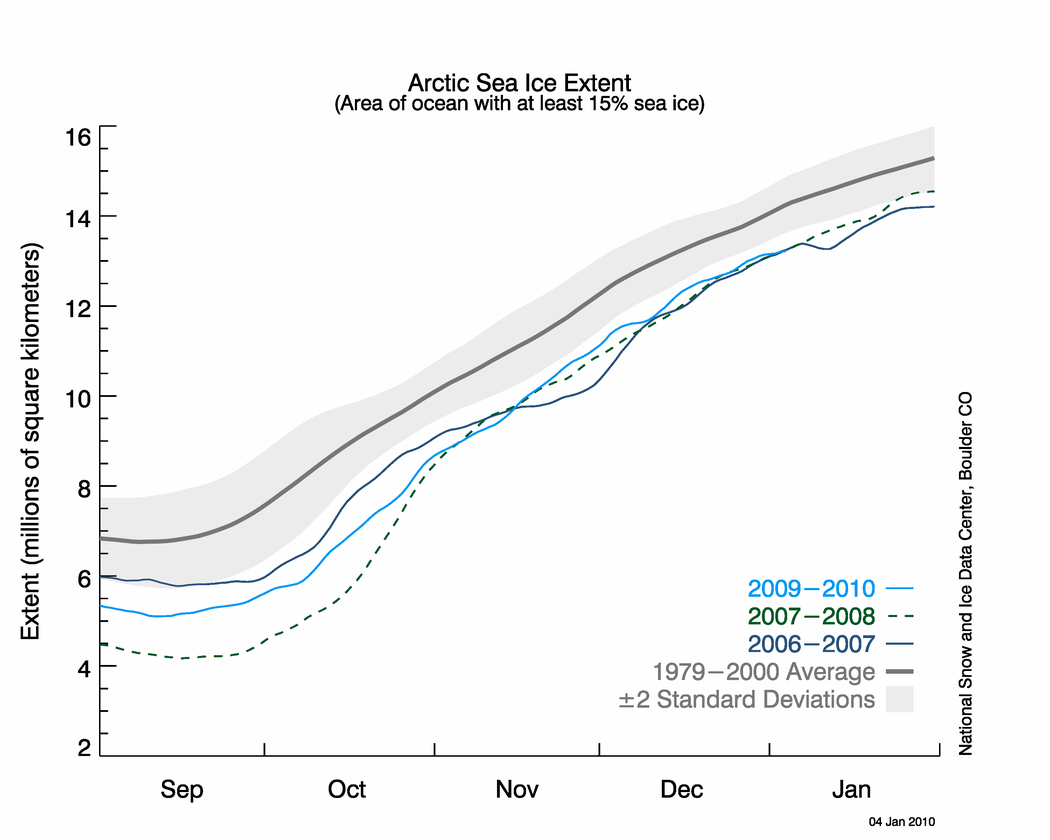
Stroeve, J., M Serreze, S. Drobot, S. Gearheard, M. Holland, J.
Maslanik, W. Meier, and T. Scambos, 2008: Arctic sea ice extent
plummets in 2007. Eos, 89(2), 13-14.

It's rather like the bottom graph (JAS) from UIUC as seen below:

http://arctic.atmos.uiuc.edu/cryosphere/IMAGES/seasonal.extent.1900-2007.jpg

It's also nearly identical to the latest from the US NSIDC graph for
the September data, but using the September average overstates the
actual minimum extent a bit:

ftp://sidads.colorado.edu/DATASETS/NOAA/G02135/Sep/N_09_plot.png

The daily extent history looks like this:

http://nsidc.org/images/arcticseaicenews/20100105_Figure2.png

You are probably not aware that the folks at UIUC like to focus on the
variable called "concentration" which produces a lower area than the
variable called "extent", which I happen to think is a better
indicator of the present situation.  Also, there's a new report in
which the authors claim the melt season in the Arctic has lengthened
by a significant number of days.

And, looking only at the gyre circulation, one can not determine the
sinking which is the THC.  the location of the "northern waters" does
not include the Nordic Seas...

E. S.
---
Robert Indigo Ellison wrote:
> Eric,
>
> I have been trying to make sense of your 'photbucket' image - it looks
> wrong on several counts.  First - long term.  See:
>
> Polyakov, I.V., Alekseev, G.V., Bekryaev, R.V., Bhatt , U.S. , Colony,
> R., Johnson, M.A., Karklin, V.P., Walsh, D. and Yulin, A.V. 2003. Long-
> Term Ice Variability in Arctic  Marginal  Seas . Journal of Climate
> 16, 2078-2085.
>
> The graph can be at Ole Humlum's site at:http://www.climate4you.com/
> on the sea ice page.
>
> Secondly - on the 1979 onwards satellite record.  Here is a university
> source for sea ice extent.
>
> http://arctic.atmos.uiuc.edu/cryosphere/IMAGES/global.daily.ice.area.withtrend.jpg
>
> You can see it is nothing like your 'photobucket' exercise.  Why the
> hell is this a valid source at all?  It is really just bloody idiocy.
> You will trust an unreferenced internet source over peer reviewed
> science because it aggrees with your preconceptions.
>
> The transport index reported by UNESCO is about transport of heat and
> salt to northern waters. The latter is the very essence of thermo-
> haline(salt)circulation.
>
> Seriously!!!!
>
> Robert

--
You received this message because you are subscribed to the Google Groups
Global Change ("globalchange") newsgroup. Global Change is a public, moderated
venue for discussion of science, technology, economics and policy dimensions of
global environmental change.

Posts will be admitted to the list if and only if any moderator finds the
submission to be constructive and/or interesting, on topic, and not
gratuitously rude.

To post to this group, send email to [email protected]

To unsubscribe from this group, send email to
[email protected]

For more options, visit this group at
http://groups.google.com/group/globalchange