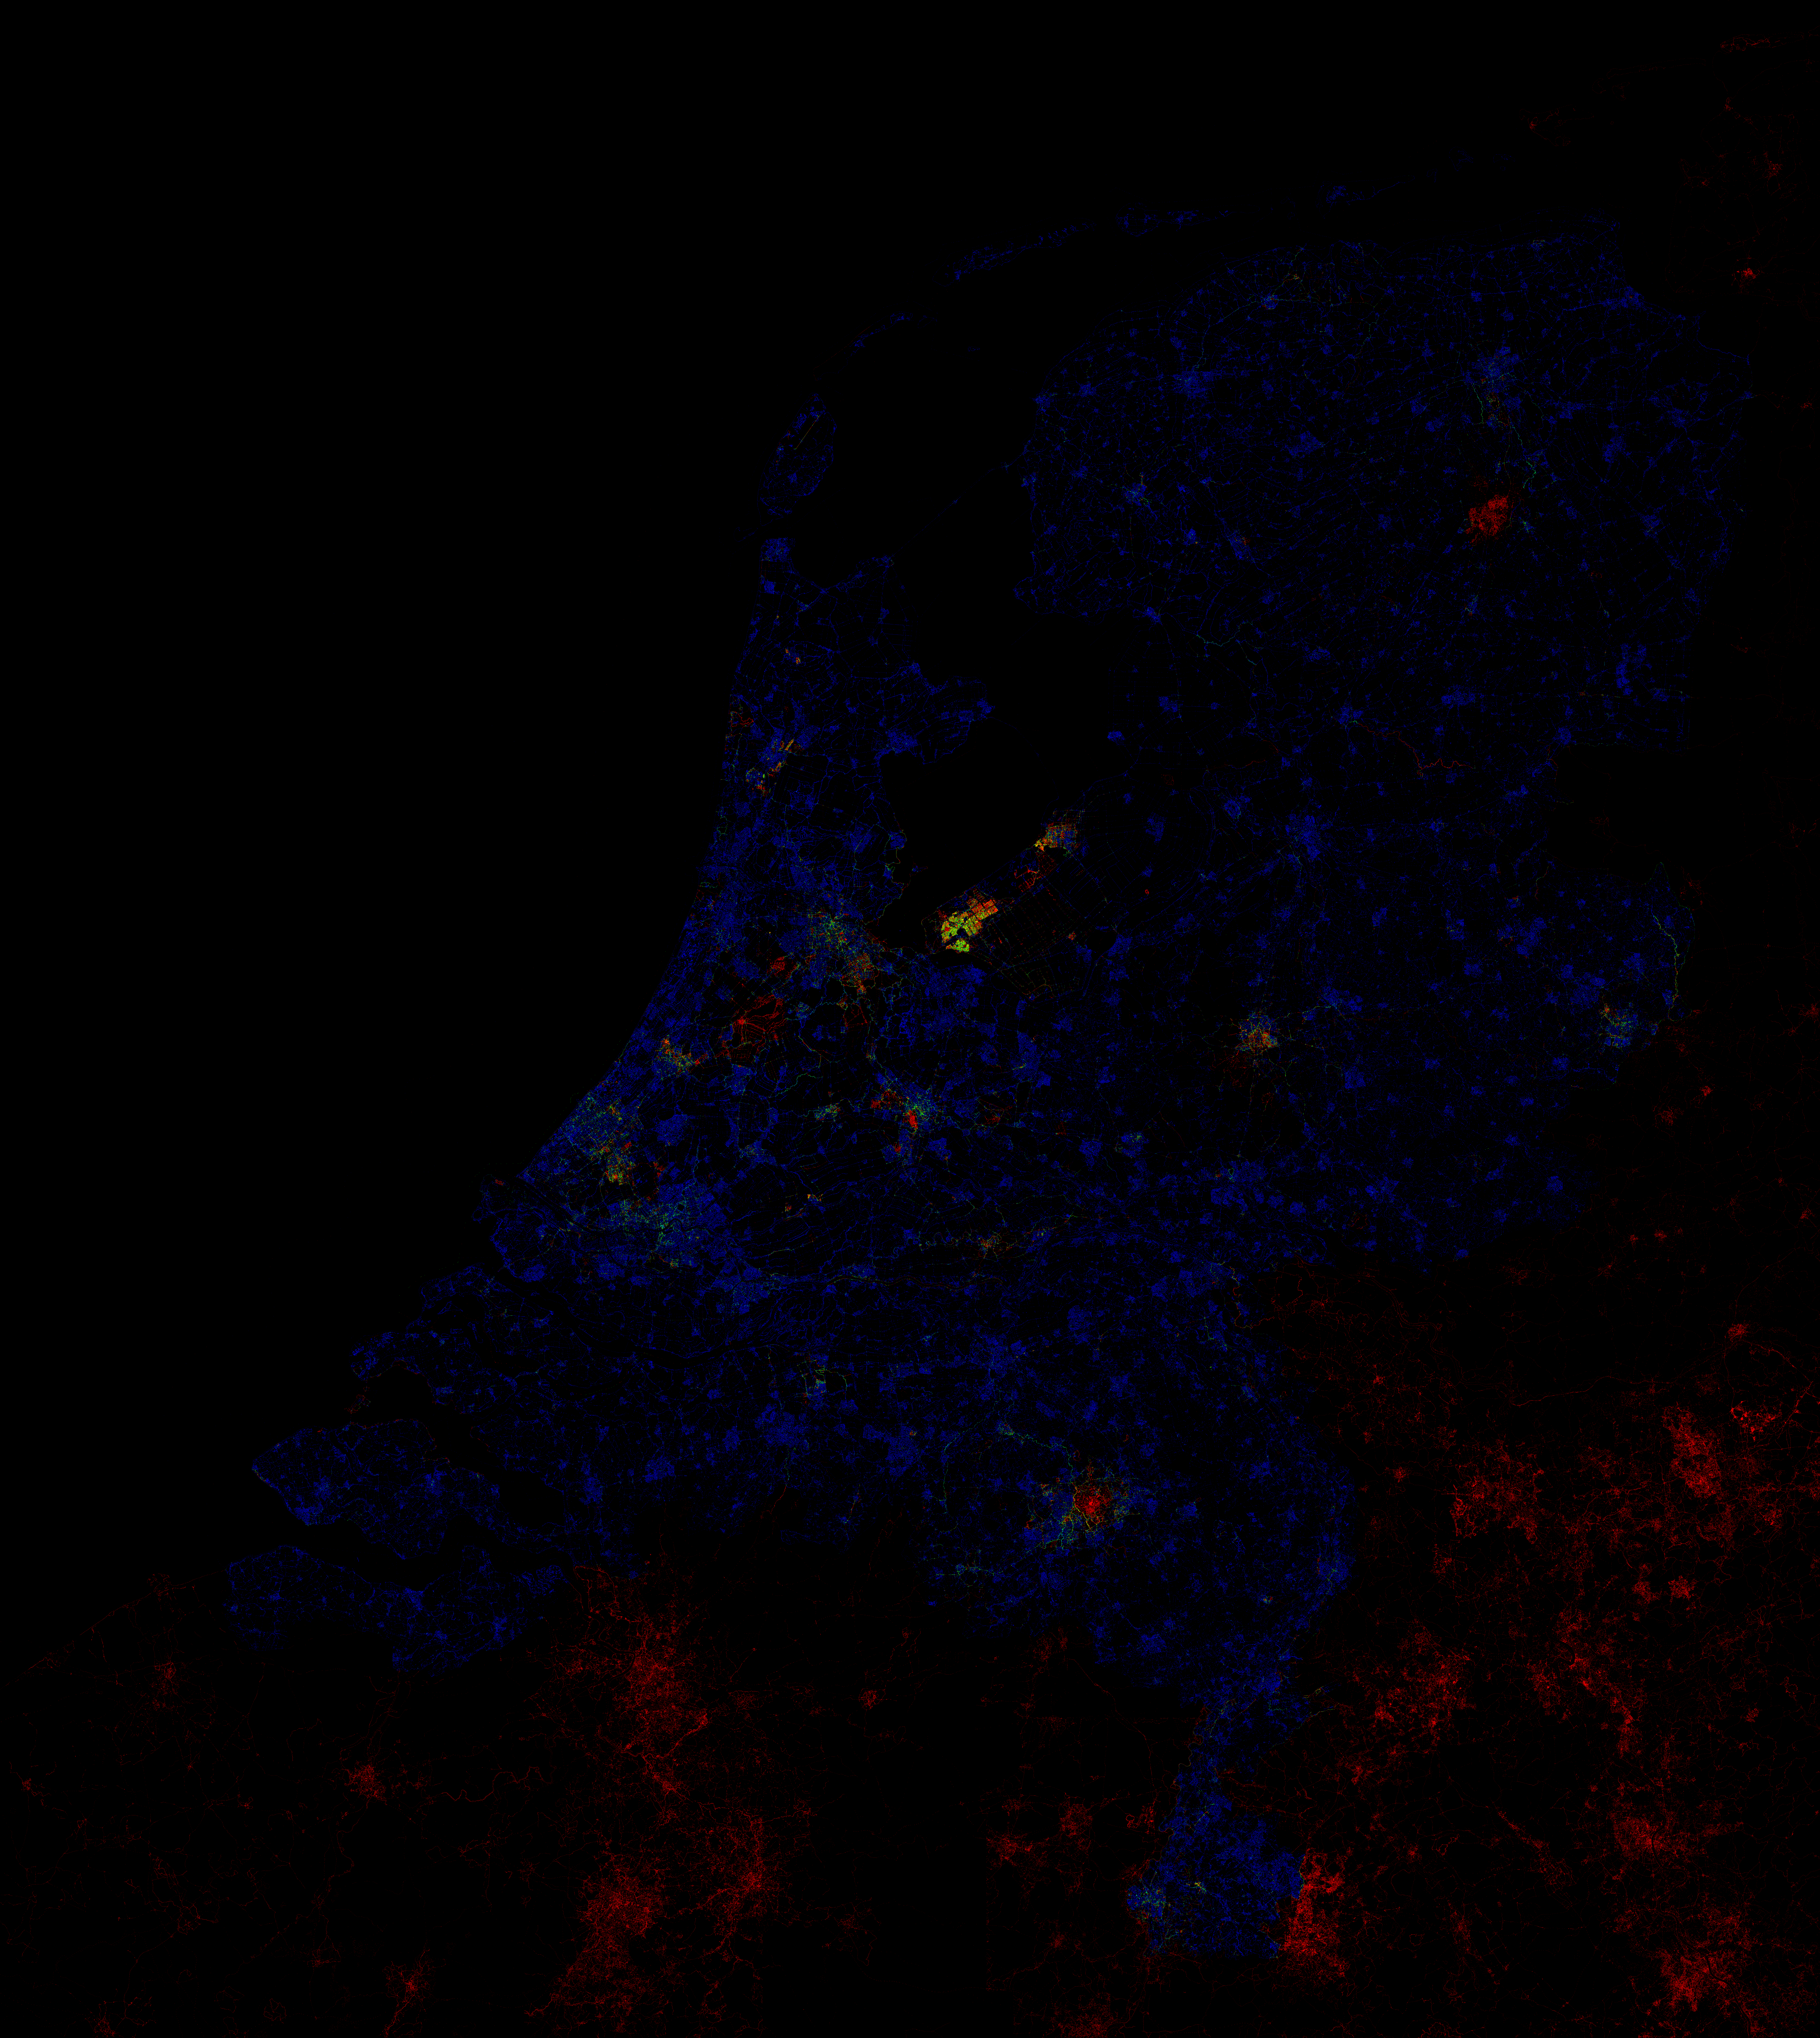
On Monday 12 May 2008, Skywave wrote:
> Freek recently created this image which shows how much of the AND data is
> untouched:
> http://www.vanwal.nl/osm/author_density_nl_20080502_full.png(warning 3 MB
> image).
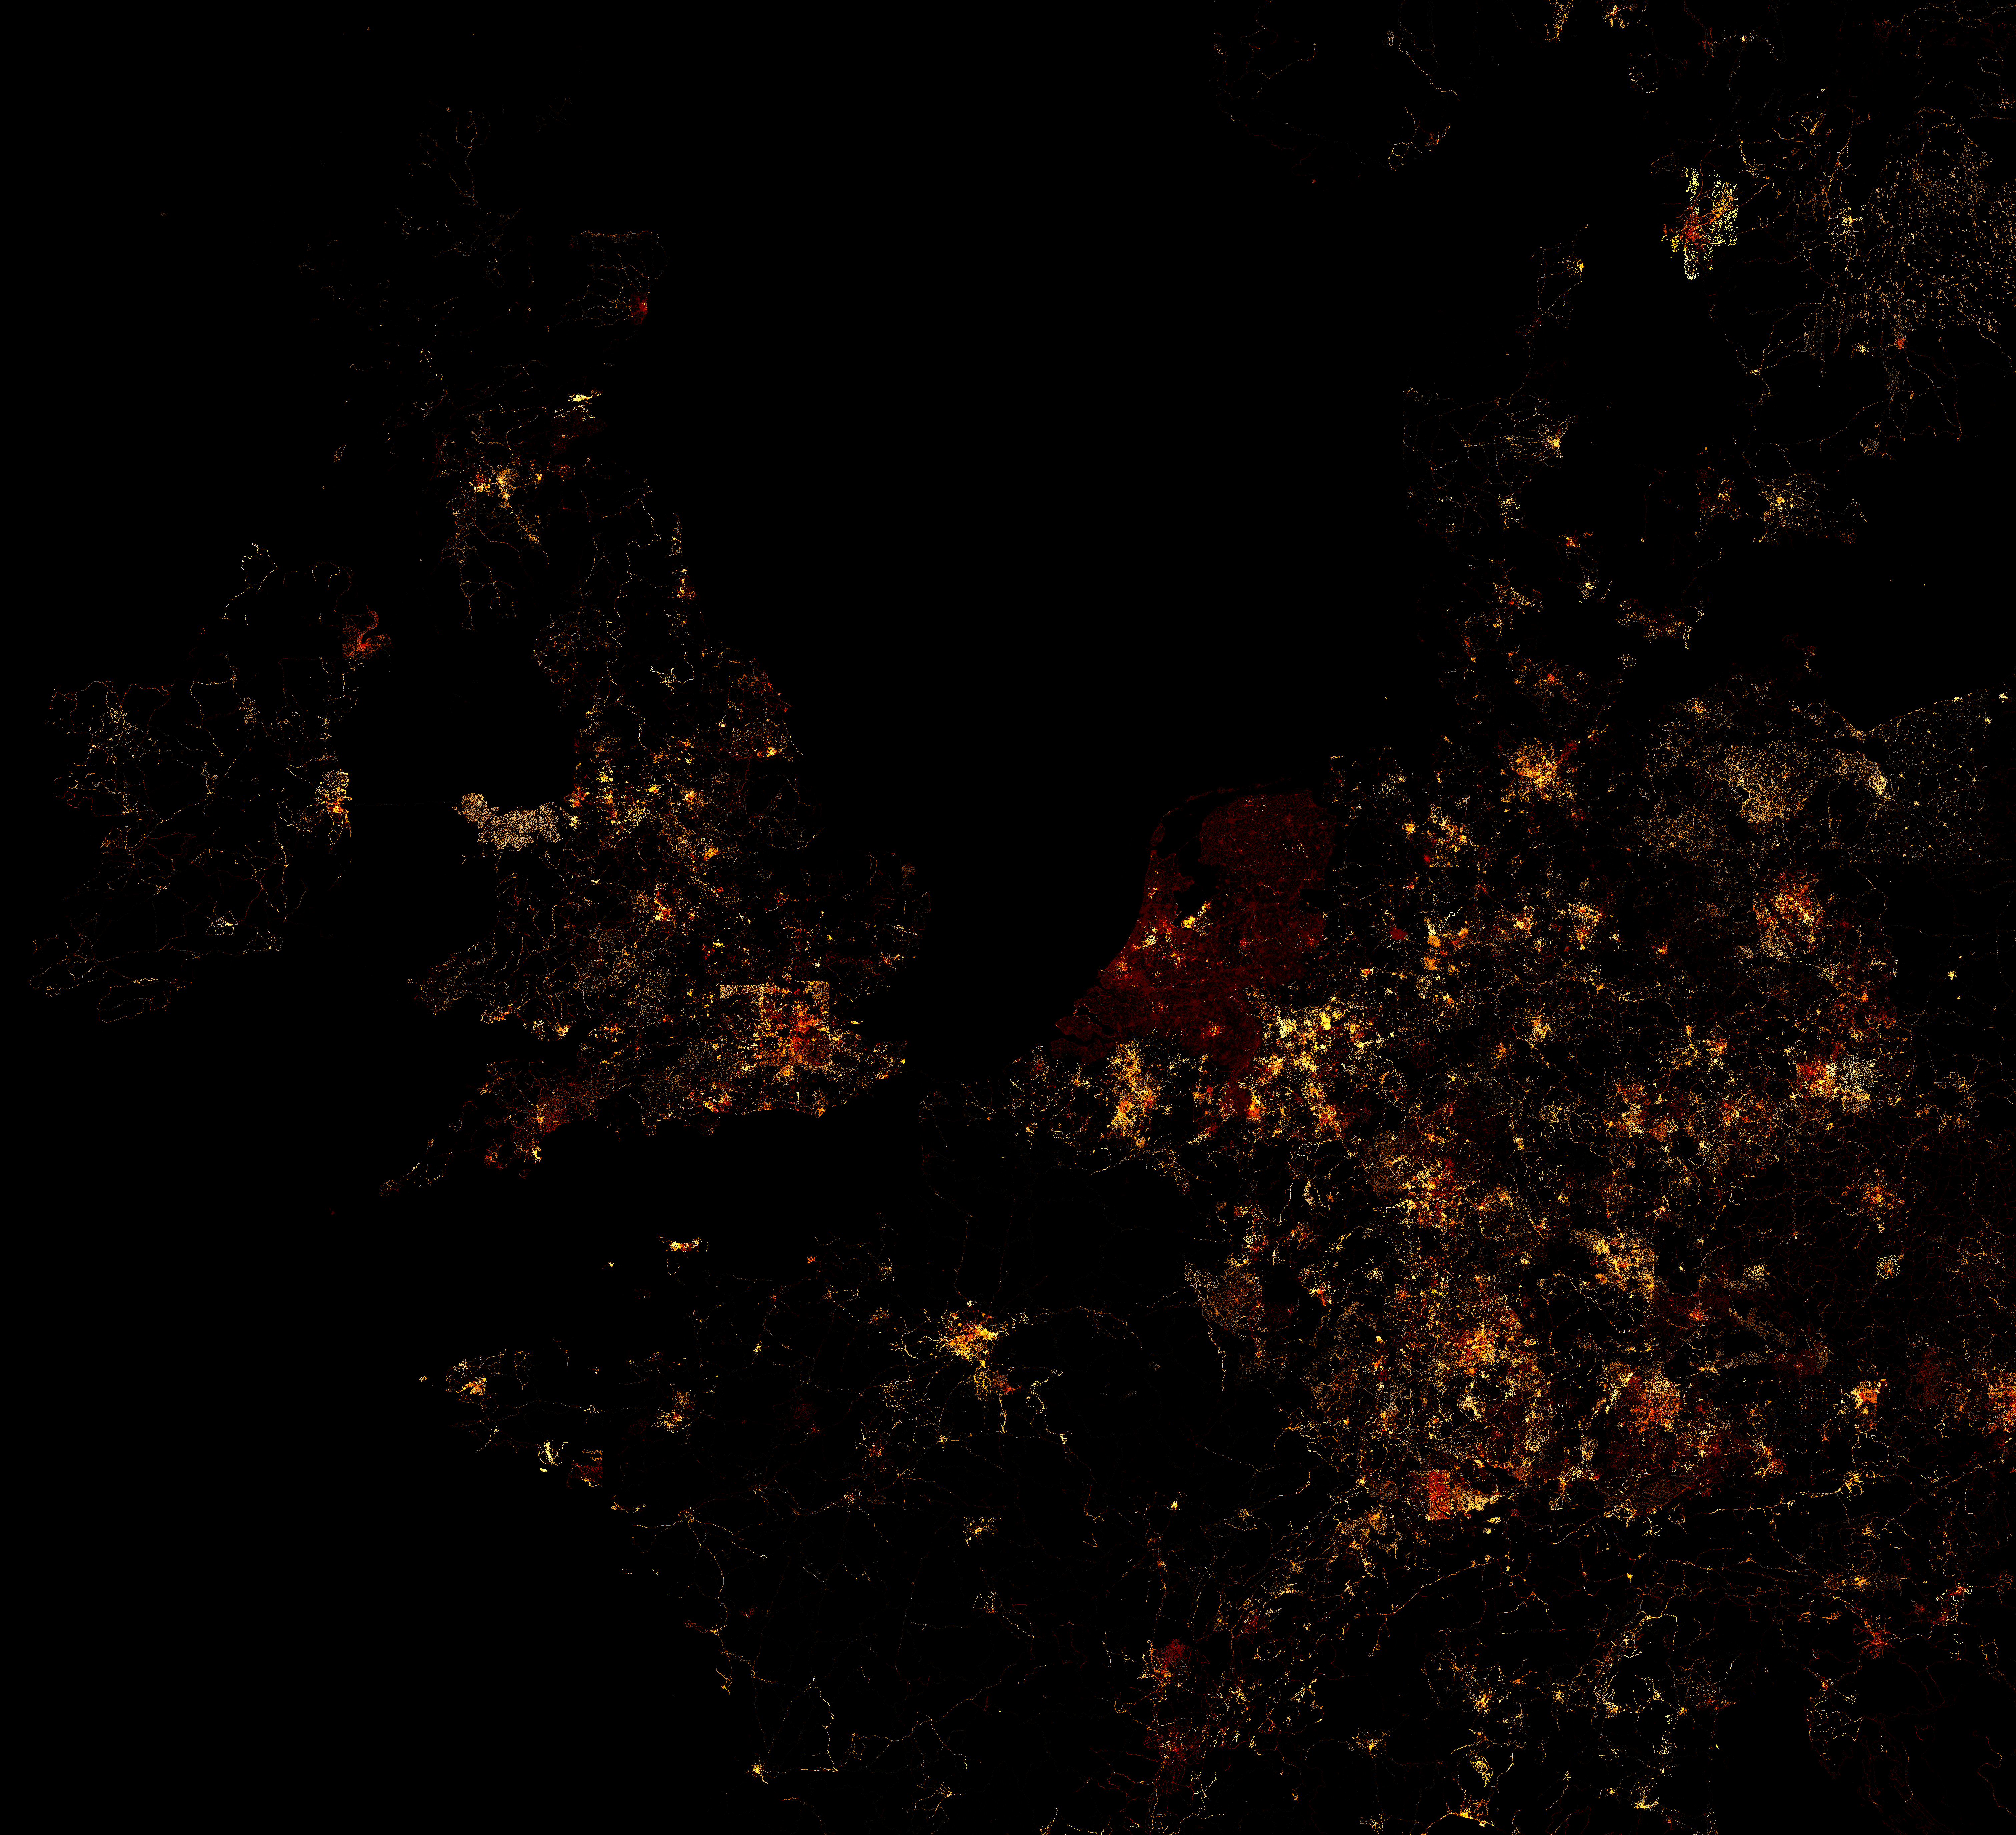
(Blue is untouched AND, green and red have relatively more changes by the
community.)

I also did an image showing the number of different (last) authors per area
for a large part of Europe (untouched AND is not so interesting outside the
Netherlands...):
http://www.vanwal.nl/osm/density/europe_1000_080513_num_authors.png (6 MB)
(Red is one author for all nodes covered by a pixel, green to blue depict an
increasing number of authors, up to around 17.)
Central London clearly has the largest number of contributions from different
people.

Secondly, I thought the average data age might show some interesting patterns
(min. data age turned out to give rather noisy pictures).
http://www.vanwal.nl/osm/density/western_europe_500_080502_avg_age_value.png
("Lava" colour map: black = old --> red --> yellow --> white = latest
contributions, compare to the dark-red AND import for a reference, this was
September 2007. Also note that dark colours have a second meaning: they
depict low node density.)
Now, London gets quite dark at some spots... More remarkably, this picture
shows that data imports dramatically decrease mapping activity (or so it
seems): not only the Netherlands show relatively little activity, also
Osnabrück looks quiet (compare for example to the Ruhr area or the area
between Brussels and Antwerp). Still, in my opinion, these imported areas are
far from complete.

I think pictures like these can give at least some impression of the current
state of affairs, but a human-maintained measure for completeness is still
necessary.

--
Freek

_______________________________________________
talk mailing list
[email protected]
http://lists.openstreetmap.org/cgi-bin/mailman/listinfo/talk