At 06:51 AM 10/27/2011, Higgins Bob-CBH003 wrote:
I examined pictures of the manifold and created a diagram to capture the
important features.  [I made a small .png version of the diagram that I
am trying to include.]   I am not sure it is schematically correct yet.
A characteristic that I believe is very important in the analysis of the
possible temperature contamination is the issue of the fittings used in
the manifold.  These use pipe threads, and appear to be NPT because of
the use of pipe dope.  At each junction of pipe threads, there will be a
large thermal resistance compared to continuous brass.  Analysis of
these across-the-thread resistances are going to be hard, particularly
with pipe dope and or Teflon tape present as is required to seal NPT.
The resistance across the thread boundaries will be high and the net
effect will be to significantly decouple the Tout thermocouple from the
manifold.
These thread boundary effects don't appear to be included in your model.
Thanks for the diagram.
So far I've just widened my original model to 12 cm ... and get
results which are closer to the measured value.
http://lenr.qumbu.com/rossi_ecat_oct11_spice.php

Update information is copied below :

http://lenr.qumbu.com/lenr_spicepics/111027_spice_0001.png
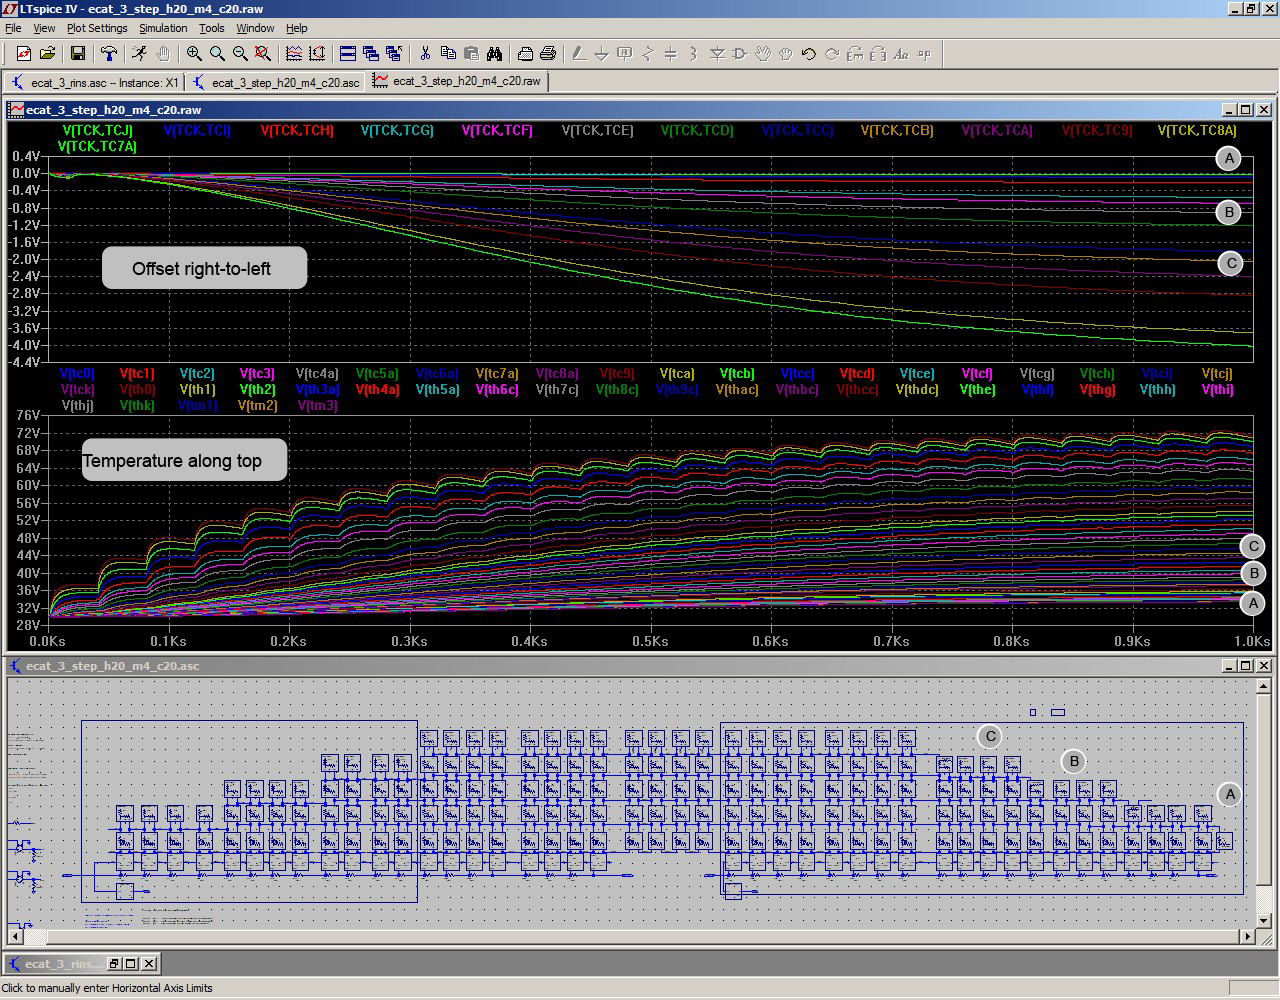
The bottom pane shows the new schematic. A is the extreme right, and
B and C are the centers of the two steps. The thermocouple is on step C.
The center pane shows the temperature across the manifold. A is now
at 33.4 C (compared to the secondary water temperature of 30 C).
The top pane shows the OFFSET in temperature from A.
This new result shows that the result varies dramatically with the
geometry -- and since the actual measurements are not known, the
results are speculative.
- - - - - - -

I can easily add in a "thread boundary" as resistors between the steps.
But I don't think I can draw any REAL conclusions from this model ...
except to say that the thermocouple should not be ANYWHERE on the manifold!