> Wouldn't any counter that has 50 picosecond resolution look the same?
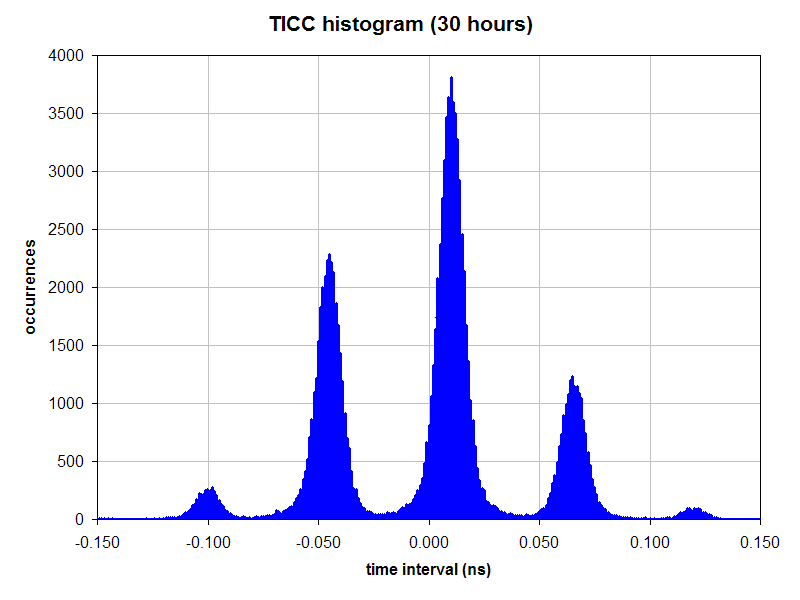
Nope. If you had a 20 GHz timebase you'd have 50 ps resolution and all your
readings would be exact multiples of 50 ps. It would be very clean and simple.
Readings of 25 ps or 49 ps or any other non-multiple of 50 ps would never
occur. The histogram would be composed of thin vertical lines -- each exactly
50 ps apart.

> Its data output is quantized by its resolution.  For example, the 5334A
> with 2ns resolution will always show bins no less than 2ns apart.

Right, the 5335A has a 500 MHz clock and so all readings are multiples of 2 ns.
The counter cannot output a reading that ends in 1 ns or .123 ns. The histogram
would be composed of thin vertical lines -- each exactly 2 ns apart.

Now it gets a bit more complicated with an interpolating counter, like a SR620
or hp5370. In this case there are fractions involved, but they are fixed
fractions.

The numerology [1] for SR620 quantization is something like 90 MHz, 111.11 ns,
1/512, for a final result of 21.701... ps.
The numerology [2] for the hp5370 is something like 200 MHz, 5 ns, 257/256,
5.01953125 ns, 1/256, for a final result of 19.607... ps
There is determinism or fine quantization in the readings because even though
this ~20 ps value is not a nice round number, it is a fixed number.

/// Consequently, for any of the 4 counters mentioned above, if you take a
noise floor dataset and sort | uniq -c you will see a small number of large
peaks. Like a picket fence. A picket fence inside a Gaussian envelope.

What we see in the TICC is something quite different. It's not a problem, just
very different. Why is that?

> You've mentioned this before, and I'm having trouble getting my head
> around it.  I may have this all wrong, but isn't the quantization simply
> the resolution of the device?  Your histogram shows humps about 50
> picoseconds apart, but that's the resolution of the counter.

Here's what's happening. Unlike the counters mentioned above there is no fixed
cycle or fraction in the TICC. The ring counter is free-running and its rate
can vary from unit to unit, from temperature to temperature, from reading to
reading. That's why the all-important post-calibration step is performed for
every reading. This results in readings that are not fixed fractions of 1 ns or
20 ps or 64 ps or 62.5 ps or any other deterministic value. So each vertical
"line" of the histogram is no longer a thin line, it is spread out quite a lot.

/// If you take a TICC noise floor dataset and sort | uniq -c you will also see
small number of large peaks, but the peaks are fat camel humps instead of thin
picket fences. [3] It has a completely different look. Gaussian camel humps
within a Gaussian envelope.

/tvb

[1] SR620 math: https://www.thinksrs.com/downloads/pdfs/manuals/SR620m.pdf
[2] hp5370 math: http://www.hpl.hp.com/hpjournal/pdfs/IssuePDFs/1978-08.pdf
[3] http://leapsecond.com/pages/ticc/


----- Original Message -----
From: "John Ackermann N8UR" <[email protected]>
To: <[email protected]>
Sent: Tuesday, January 08, 2019 1:07 PM
Subject: Re: [time-nuts] Short term 10MHz source


> You've mentioned this before, and I'm having trouble getting my head
> around it.  I may have this all wrong, but isn't the quantization simply
> the resolution of the device?  Your histogram shows humps about 50
> picoseconds apart, but that's the resolution of the counter.
>
> Wouldn't any counter that has 50 picosecond resolution look the same?
> Its data output is quantized by its resolution.  For example, the 5334A
> with 2ns resolution will always show bins no less than 2ns apart.
>
> What am I missing?
>
> John
> ----
>
> On 1/8/19 3:34 PM, Tom Van Baak wrote:
>> John,
>>
>> Your hunch is correct. For most modern TIC devices, measurement noise is
>> white. That is, if you do a self-test using a common DUT & REF you get a
>> nice clean Gaussian plot. But the TICC is not like that. The TICC is based
>> on a ring counter and so there is a *high* degree of quantization. This is
>> not bad, per se, but it does impact how one should perform, or interpret, a
>> noise floor test.
>>
>> Take a look at: http://leapsecond.com/pages/ticc/
>>
>> And in particular: http://leapsecond.com/pages/ticc/ticc-log5342-hist-1.gif
>>
>> What this means is that a noise floor measurement made with the same chA and
>> chB and REF could be quite wrong. This is not an indictment against the
>> TICC. I have several, and use them all. But because of the strong
>> quantization effects you can't just feed in a common DUT and REF and expect
>> that to represent all possible real-life phase measurements. Those quantized
>> "camel humps" are really quite extreme with the TICC.
>>
>> /tvb


_______________________________________________
time-nuts mailing list -- [email protected]
To unsubscribe, go to
http://lists.febo.com/mailman/listinfo/time-nuts_lists.febo.com
and follow the instructions there.